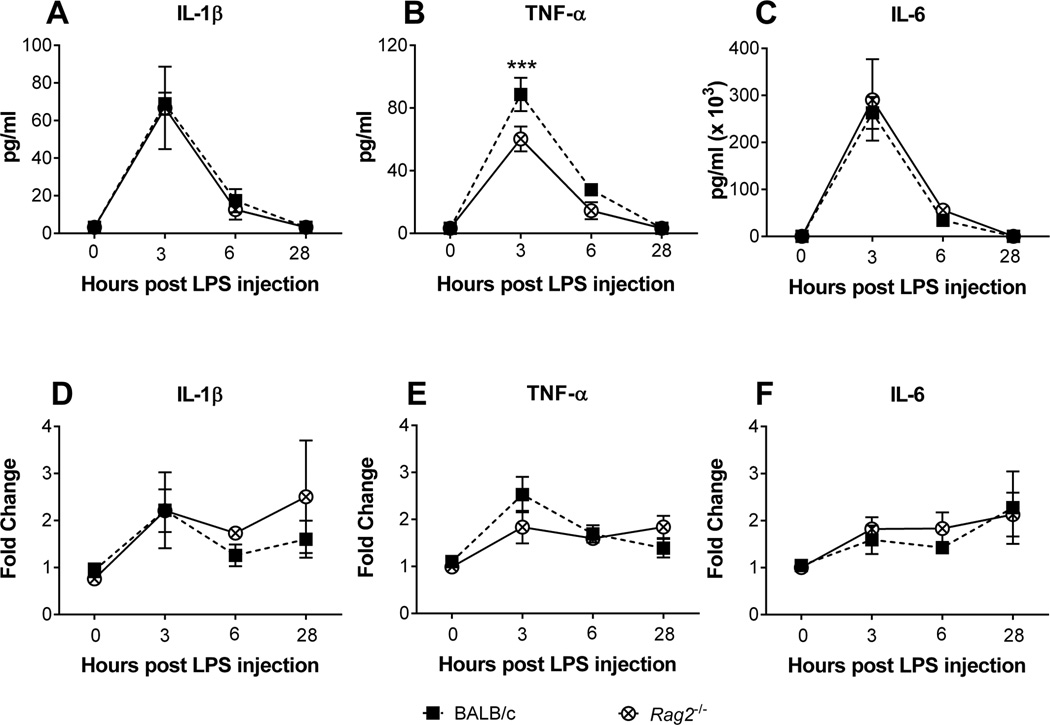
Figure 5.
Plasma circulating levels of interleukin-1 beta (A) tumor necrosis factor alpha (B) and interleukin-6 (C) in BALB/c and Rag2−/− mice receiving a LPS dose of 1 mg/kg of body weight. Hypothalamic mRNA expression of interleukin-1 beta (D) tumor necrosis factor alpha (E) and interleukin-6 (F) in the same groups of mice. Two-way ANOVA analysis indicates significant effects of time for all plasma cytokine levels, as well as mRNA levels for interleukin-6 and tumor necrosis factor alpha (A–C, E, F: p ≤ 0.001), with a significant effect of genotype (p = 0.004) and an interaction (p = 0.015) for levels of tumor necrosis factor alpha. Fisher's LSD post hoc. *** p < 0.001.

