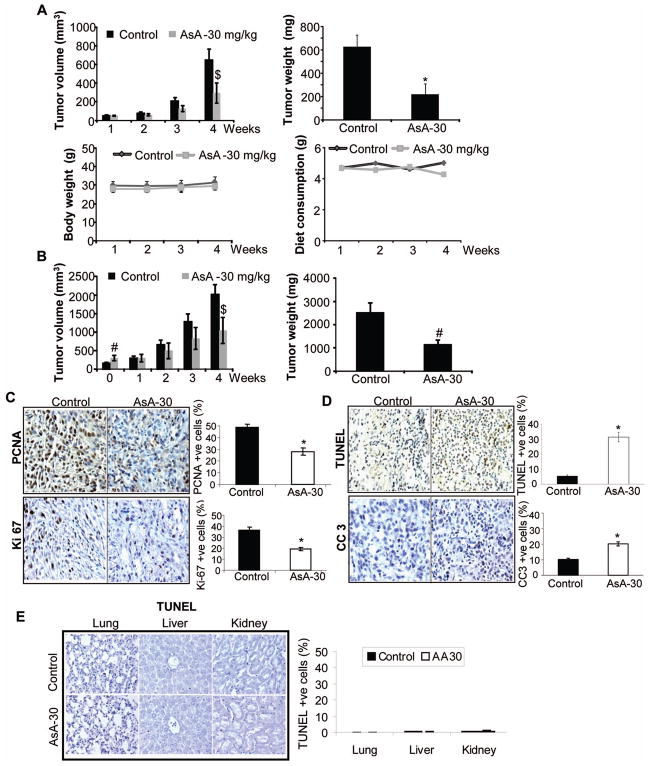
Figure 2.
In vivo efficacy of orally administered AsA against U87MG ectopic xenografts. (A) U87MG xenografts were initiated, and mice were gavaged either saline or AsA as detailed in methods. Data shown are: Tumor volume (in mm3) as a function of time (upper left panel); tumor weight (mg) per mouse at the end of study (upper right panel); average body weight (g) per mouse as a function of time (lower left panel); and average diet weight consumption per mouse per day (lower right panel). (B) U87MG xenografts were initiated, and once xenografts achieved approximately 200 to 300 mm3 tumor volume, mice were gavaged with saline or AsA. Data shown are: tumor volume (in mm3) as a function of time (left panel) and tumor weight (g) per mouse at the end of study (right panel). A & B data are mean±SEM from 5 mice in each group with 10 xenografts. (C–D) U87MG xenografts were analyzed by IHC for proliferation biomarkers (PCNA and Ki-67) and apoptosis (TUNEL and CC3). Percentage of PCNA, Ki-67, TUNEL, and CC3 positive cells was calculated by counting the number of positive stained cells (brown stained) and the total number of cells at five arbitrarily selected fields from each tumor at 400x magnification. The data shown in the bar diagrams is the mean±SEM of 7–10 samples. (E) Lungs, liver and kidneys from each mouse (U87MG ectopic xenograft experiment) were analyzed for apoptosis by TUNEL. TUNEL-positive cells are shown in the bar diagram as mean±SEM of 3–5 samples. *, p≤0.001; #, p≤0.01; $, p≤0.05

