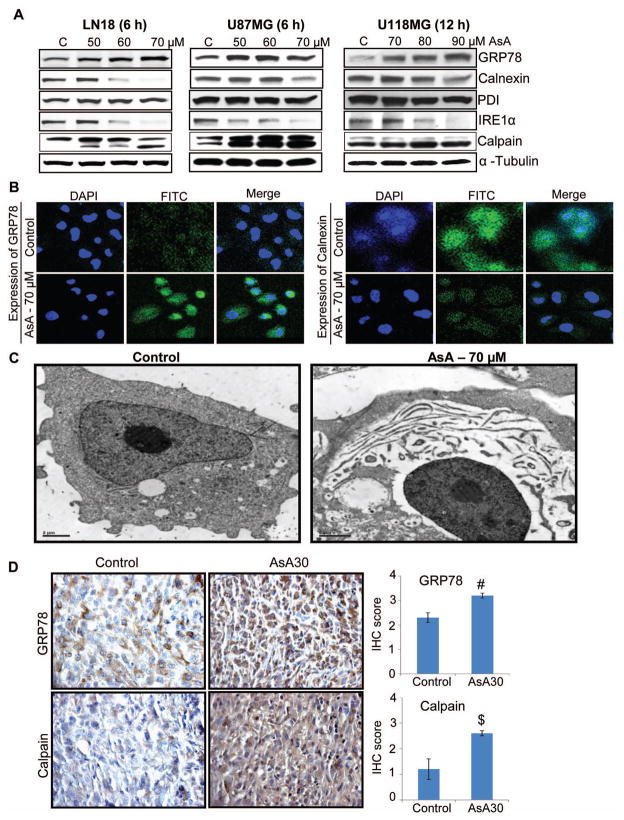
Figure 6.
AsA induces ER stress in GBM cells both in vitro and in vivo. (A) GBM cells were treated with AsA and the expression of ER stress markers was analyzed by Western blotting. Protein loading was monitored by re-probing the membrane with α-tubulin antibody. (B) LN18 cells were grown on cover slips and treated with 70 μM AsA for 6 h and processed for immunofluorescence for GRP78 (FITC-green) and Calnexin (FITC-green) expression. DAPI-blue was used to stain the nuclei. (C) LN18 cells were treated with 70 μM AsA for 2 h and analyzed by electron microscopy for AsA effect on cellular organization. (D) U87MG ectopic xenografts were analyzed for GRP78 and Calpain expression. Immunoreactivity of GRP78 and Calpain was analyzed in 5 random areas for each tumor tissue and was scored as 0+ (no staining), 1+ (weak staining), 2+ (moderate staining), 3+ (strong staining), 4+ (very strong staining). IHC scores (as mean±SEM) for GRP78 and Calpain in control versus AsA30 are shown as bar diagram of 5 samples. #, p≤0.01; $, p≤0.05

