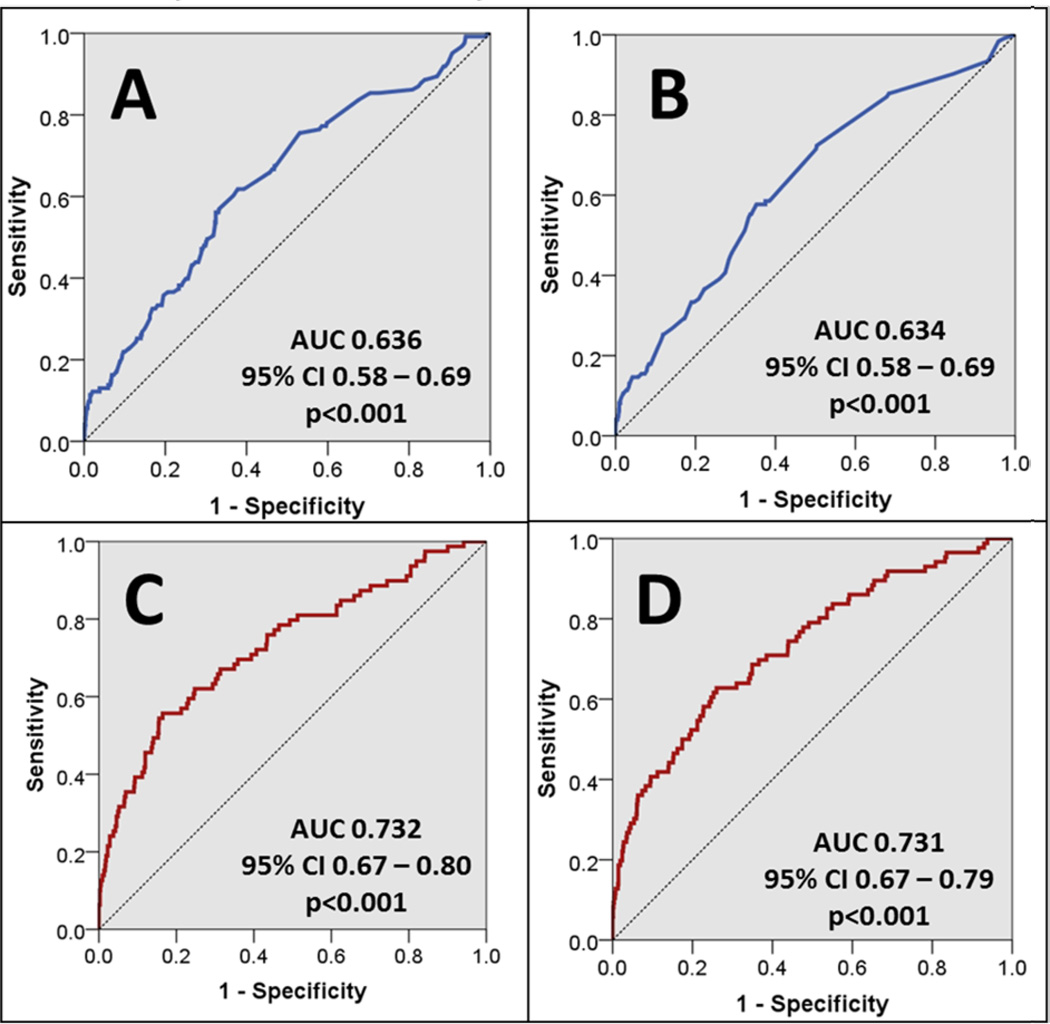
Figure 1. Comparison of predictive model accuracy based on the input of fixed and dynamic variables.
These are the ROC curves for the four predictive models. Figures 1A and 1B display the initial and final ROC curves for the models using only fixed variables listed in Table 1, respectively. Figures 1C and 1D display the initial and final ROC curves that utilize both the fixed and dynamic variables listed in Tables 1 and 2, respectively.

