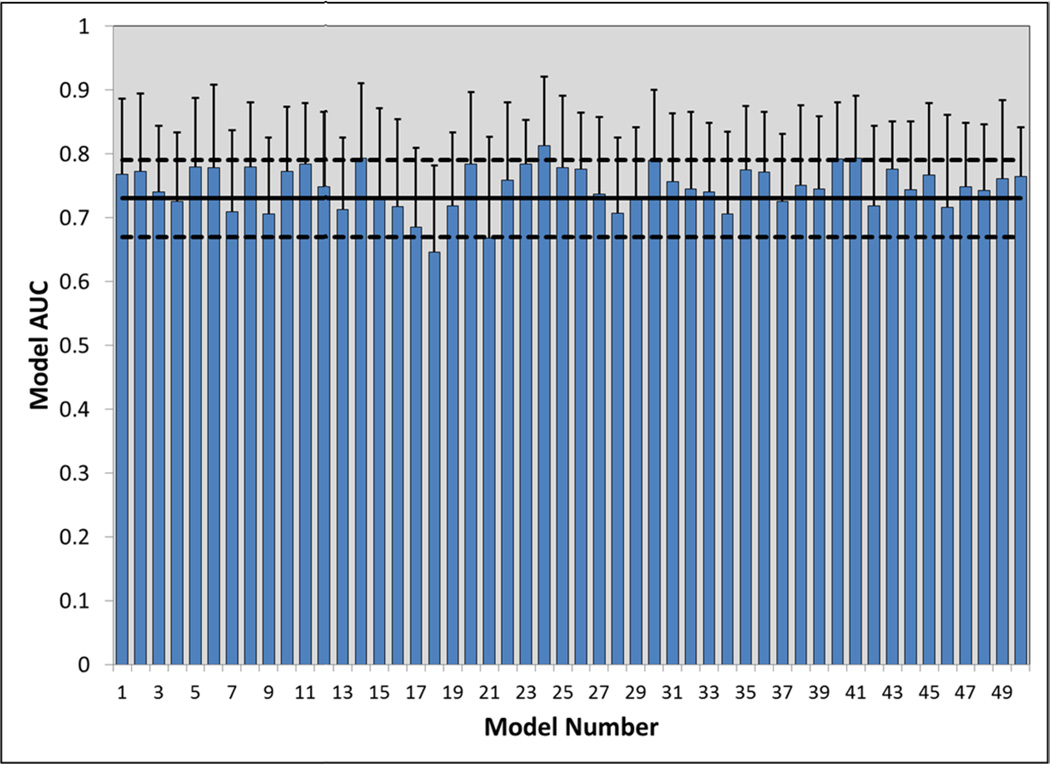
Figure 2. Internal model validation using 50 random iterations of 50% sampling.
This bar graph depicts the AUCs for the 50 models that were simulated as part of the internal validation analysis, using a 50% random sampling for each simulation model. Each AUC within these simulations was statistically similar to the AUC produced in the original model (AUC 0.731, p>0.06).

