FIGURE 3.
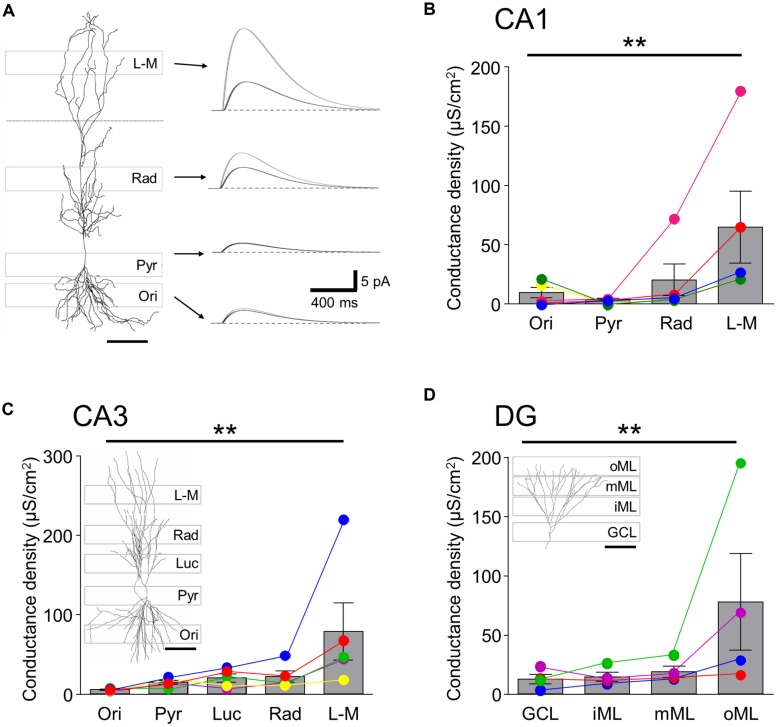
Single-cell simulation of GABABR mediated currents and conductance densities in 3-D reconstructed hippocampal neurons.(A, left) 3-D reconstruction of a CA1 PC shown in conjunction with the laminar stripes in which Rubi-GABA was released (gray boxes overlain). (A, right) Simulated GABABR-mediated ISPC pairs at the somatic recording site (black traces) and the illuminated perisomatic or dendritic membranes (gray traces) corresponding to the layer specific photostimulation windows (indicated by the arrows). The dendritic conductances were set so that the somatic IPSC amplitudes match the experimentally observed light induced current amplitudes. Note the difference in the amplitudes of the dendritic and somatic currents. (B) Summary bar chart showing the GABABR-mediated conductance densities for the illumination windows in the different layers of the CA1 area derived in the simulations. Average data is overlain by data from individual experiments (colored circles and lines). Note that the conductance densities were consistently largest in str. L-M. (C,D) Summary bar charts showing the conductance densities for membrane surfaces in the illumination windows in the different layers for CA3 PCs and DGCs, respectively; same format as in (B). Representative cell reconstructions with the illumination windows superimposed are shown as insets. Scale bars: 100 μm. Statistics shown: **P < 0.01, from Friedman’s tests.

