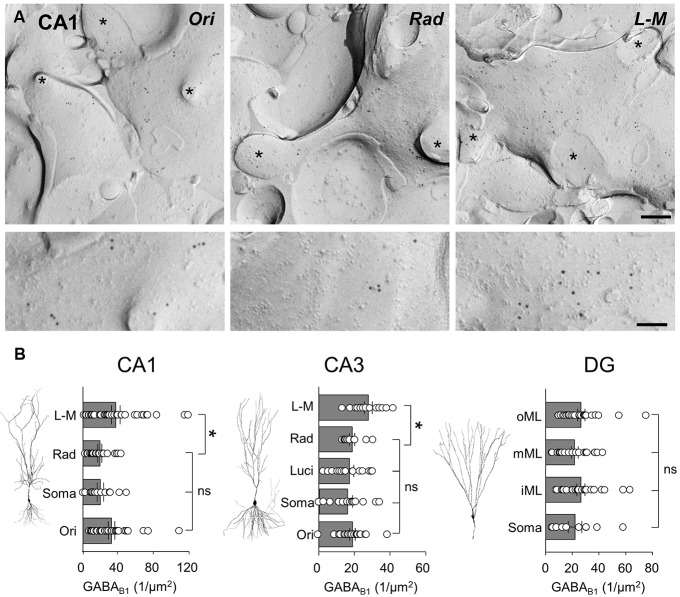
FIGURE 4.
GABAB1 receptor subunits are differentially expressed along the somatodendritic axis of hippocampal principal cells. (A) Representative SDS-FRL electron micrographs of spiny dendrites from str. oriens (Ori), str. radiatum (Rad), and stratum L - M (L - M) of the CA1. The putative CA1 PC dendrites show immunogold labeling for GABAB1 receptor subunits (10 nm gold particles). Spines and fractured spine necks are indicated with asterisks (∗). Scale bar: 200 nm (top row), 100 nm (bottom row). (B) Summary bar charts of the GABAB1 subunit surface density from somatodendritic compartments in different layers of CA1 (left), CA3 (middle), and DG (right) are shown alongside representative images of principal cells. Mean surface densities are overlain by density measurements of individual P-face structures. Statistics shown: ns = P > 0.05, *P < 0.05, one-way ANOVA.

