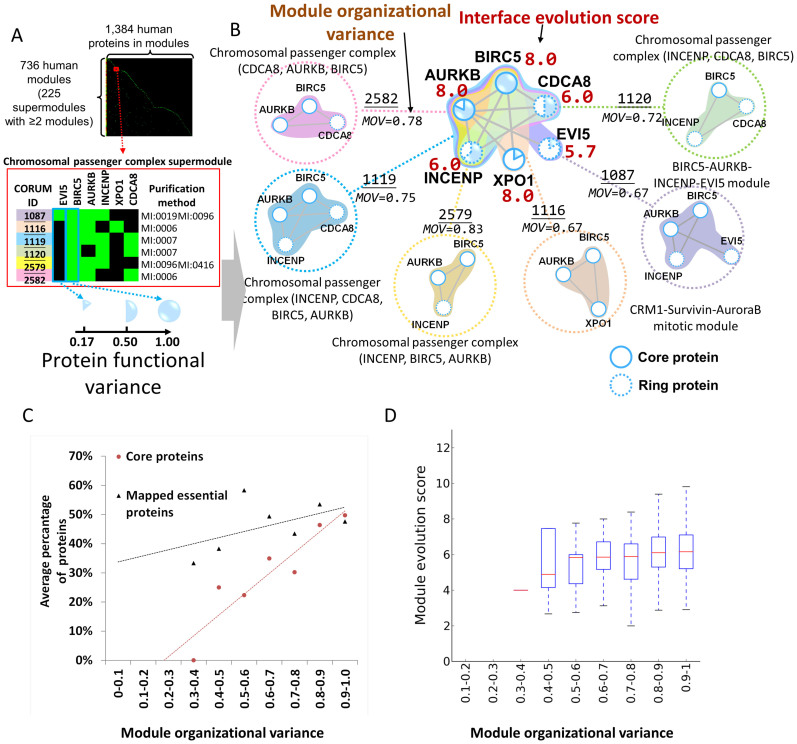
Figure 4. Protein functional variance and module organizational variance of supermodules.
(A) Clustering matrix of 736 human modules with 1,384 proteins. The profile of the CPC supermodule with six experimental modules identified by various purification methods. (B) The chromosomal passenger complex supermodule comprises six CORUM modules. Module organizational variance (MOV), protein functional variance (PFV), and IES (red) are shown. Solid and dashed circles denote core proteins and ring proteins, respectively. (C) Pearson's r values between MOV values and percentages of core proteins (red) and mapped essential proteins (black) were 0.93 and 0.52, respectively. (D) The distributions (boxplots) of MOV against module evolution scores (MES).

