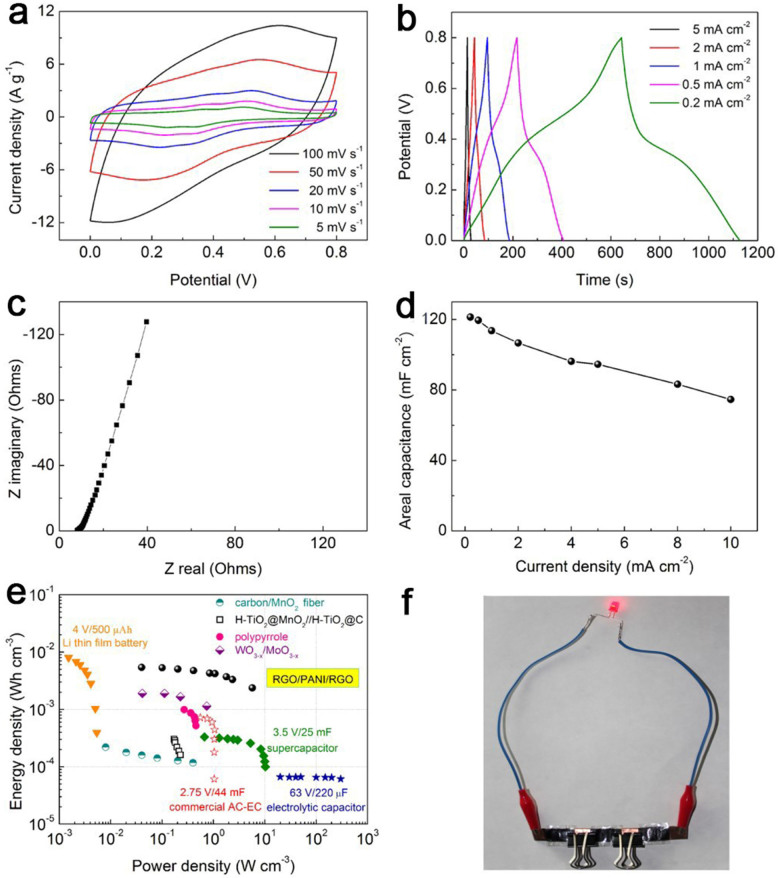
Figure 6.
(a) CV curves, (b) GV charge–discharge curves, (c) Nyquist plot and (d) areal capacitance versus discharge current for the solid-state device. (e) Ragone plot of energy density versus power density for different solid-state device. (f) Photograph of a red LED lit by in-series solid-state SCs with three units.

