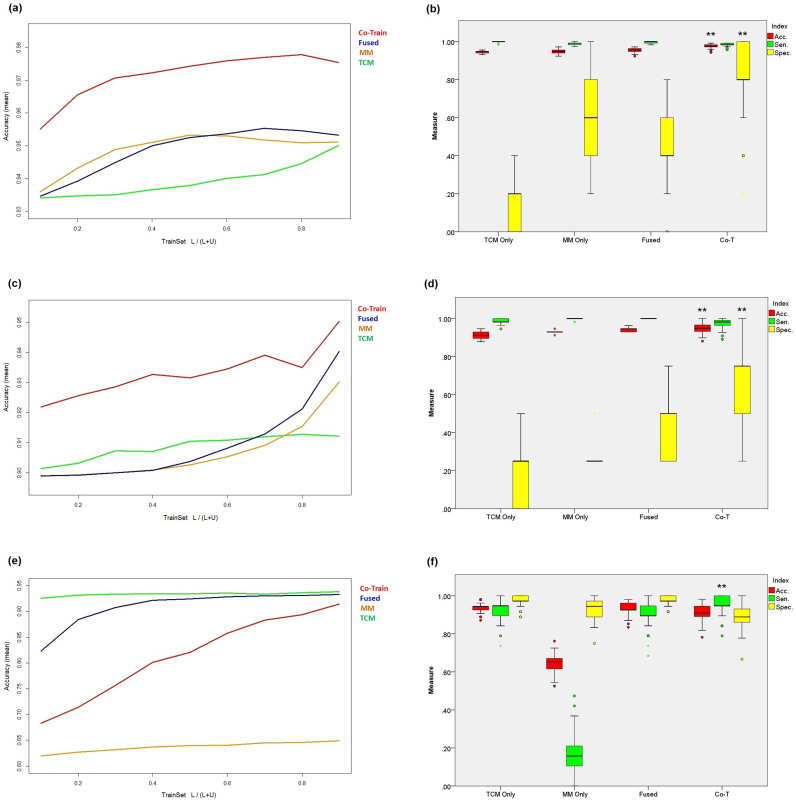
Figure 2. Evaluation of the co-training algorithm.
(a), (c) and (e) present the average accuracy of the differentiation models on CHB vs. health controls, DS vs. NDS and LGDH vs. LSSD respectively, with the percentage of training data increased from 10% to 90% at an interval of 10%. (b), (d) and (f) present the distribution of accuracy, sensitivity and specificity for individual and combined view of TCM and MM, as well as the co-training model on each syndrome differentiation. (**p < 0.001, *p < 0.01, random times = 100).

