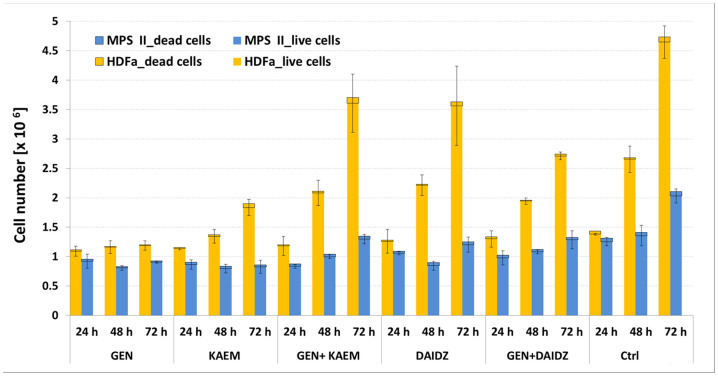
Figure 1. Determination of count and viability of HDFa and MPS II cells respectively with 100 μM of genistein, 100 μM of kaempferol, 100 μM of daidzein, mix of genistein and kaempferol or genistein and daidzein (30 µM each), and with 0.05% DMSO (Ctrl) for different periods of time (24, 48 and 72 h).
Data are represented as mean and bars show SD values of experiments run in triplicate.

