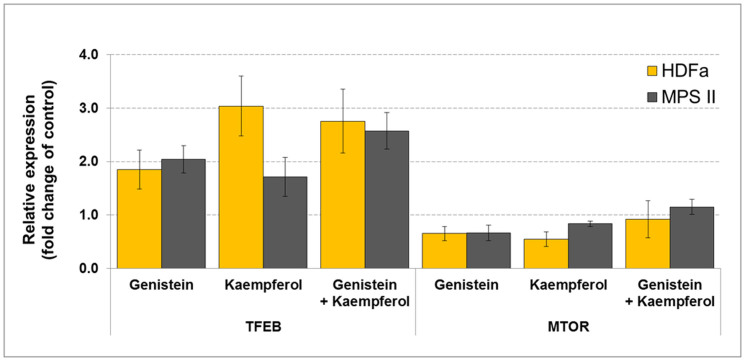
Figure 6. TFEB and MTOR expression analysis in HDFa and MPS cells via real-time qRT-PCR.
Data represent averaged values ± SD from n = 3, and mean significant differences for samples treated for 24 h with various flavonoids (100 µM genistein, 100 µM kaempferol, and mixtures of them of 30 µM each) against non-treated, with respect to endogenous reference gene GAPDH (in HDFa) and RPLPO (in MPS II), with p < 0.005 as determined by ANOVA with Tukey's HSD Post Hoc.

