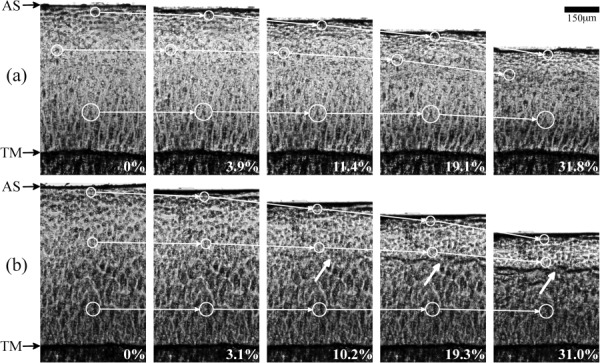
Fig. 2.

Representative images used in the calculation of chondrocyte displacement and elastic modulus for (a) fresh tissue and (b) cryopreserved tissue. AS indicates the articular surface and TM indicates the tidemark. The white circles connected by arrows show the displacements of chondrocytes through several strains (%). The thick white arrows indicate the formation of a black line.
