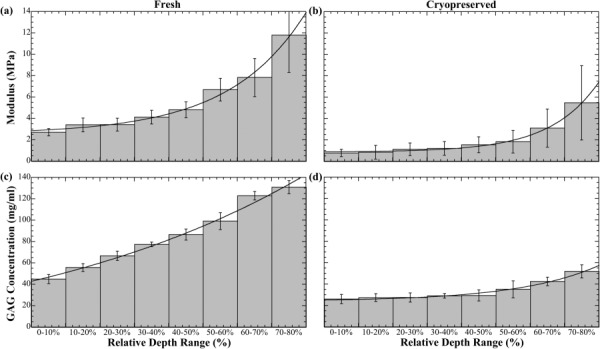
Fig. 4.

Depth-dependent profiles of elastic modulus and GAG concentration. Depth is plotted on a relative scale where 0–10% indicates the SZ and all other percentage ranges indicate relative intratissue depth. Values and error bars are mean ± S.D. and modulus is fit exponentially through 80% relative depth as (a) E f = 2.57 + 0.25e0.45 x and (b) E c = 0.90 + 0.02e0.71 x, where x is relative depth, and E f and E c are the elastic modulus of fresh and cryopreserved cartilage, respectively.
