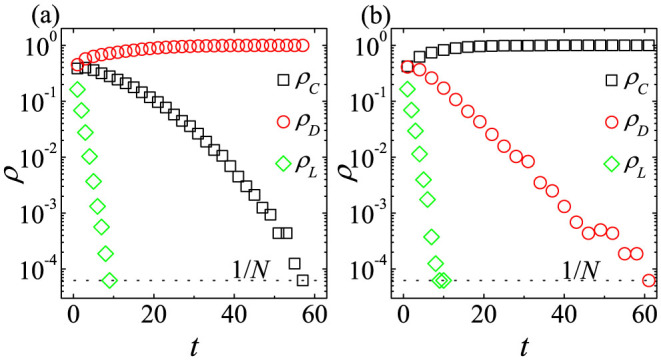
Figure 5. Time dependence of ρC(t), ρD(t), and ρL(t) on random networks with N = 16000 for r0 = 0.3.

Plots of ρC(t), ρD(t), and ρL(t) (a) for moderate 〈k〉 ( = 30) and (b) for low 〈k〉 ( = 10). (a) For moderate 〈k〉 ( = 30), ρD increases with t, whereas ρC and ρL decreases. Finally, the stationary D-state emerges. (b) For low 〈k〉 ( = 10), ρC increases with t, whereas ρD and ρL decreases. Finally, the stationary C-state appears. The time dependences for high 〈k〉 are not shown, because they are nearly the same as those shown in Fig. 1(b).
