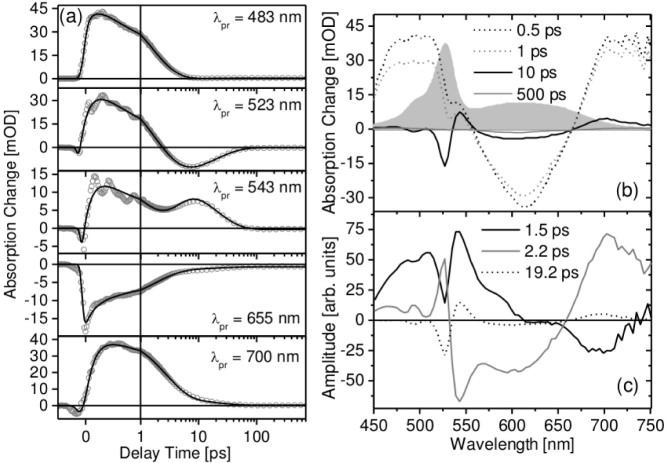
Figure 2.
(a) Transient absorption traces recorded at the DTE excited state absorption (λprobe = 483 nm and 700 nm), the DTE ground state bleach (λprobe = 655 nm) and in the region of the derivative-like transient absorption signal (λprobe = 523 nm and 543 nm) after excitation of pss BODIPY-DTE at 600 nm; gray circles and black lines represent the transient absorption data and the fit curves, respectively. (b) Spectra at fixed delay times; gray area represents the pss BODIPY-DTE ground state absorption. (c) Decay associated spectra of τ2, τ3 and τ4 obtained from a global fitting analysis of the transient absorption data.

