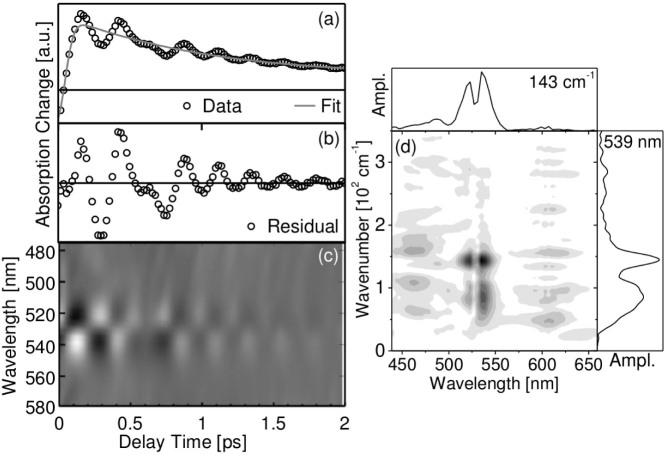
Figure 3.
(a) Transient absorption trace recorded at λprobe = 539 nm after photoexcitation of pss BODIPY-DTE (circles) and corresponding fit (line); (b) residual oscillations obtained by subtraction of the model function; (c) 2D spectrum of the residual oscillations (black and white regions indicate negative and positive values, respectively); (d) Fourier transformed spectrum of the oscillatory residuals.

