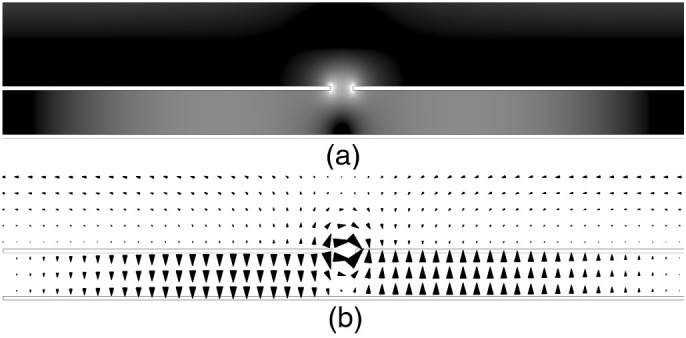
Figure 2. A cross-section of a single unit cell of a typical monograting structure perpendicular to the slit at the fundamental resonant frequency.

The metallic sections are shown as bordered white regions. (a) Resonant time-averaged electric field magnitude where black to white represents increasing field strength. (b) Resonant electric field vector at a phase corresponding to maximum field enhancement, showing both the quantisation and reversal of the field beneath the metallic strip.
