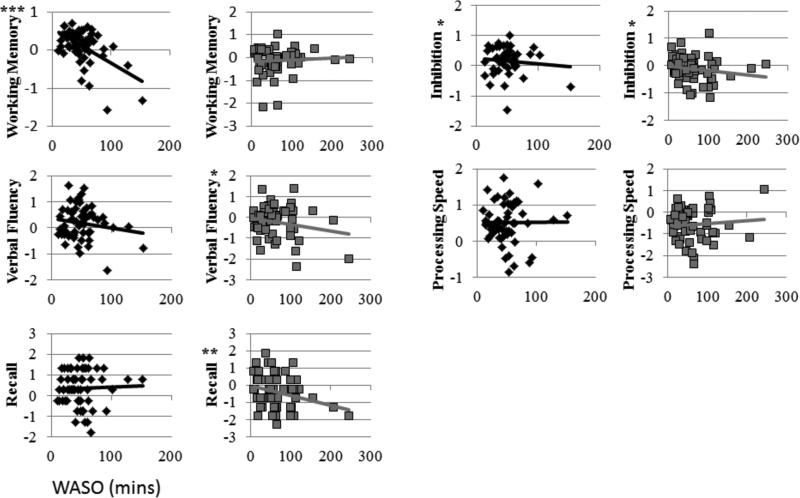
Figure 1.
Scatter plots of the linear bivariate relationships between WASO (x axis) and each cognitive domain (y axis) for young (black) and older participants (gray). Trend lines reflect linear relationships. Significant linear relationships are denoted, p < 0.05 = *, p < 0.01 = **, p < 0.001 = ***

