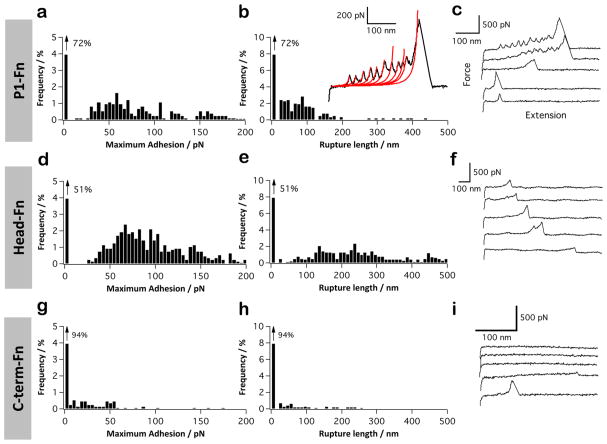
Figure 2.
P1 binds fibronectin via the head region. (a–i) Adhesion force histogram (a, d, and g), rupture length histogram (b, e, and h), and typical force curves (c, f, and i) obtained by recording force curves (n = 1024 curves for each condition) in PBS buffer between solid substrates functionalized with fibronectin (Fn), and AFM tips functionalized with full-length P1 (a–c), P1 globular head (d–f), or C-terminal region (g–i). The red lines in panel (b) shows that for the Fn interaction, sawtooth force profiles were observed and well-described by the worm-like-chain model, using a persistence length lp of 0.4 nm: F(x) = kBT/lp [0.25(1−x/Lc) −2 + x/Lc −0.25], where Lc is the contour length of the molecule, kB is the Boltzmann constant, and T the absolute temperature. For each condition, similar data were obtained using at least 3 different tips and 3 different substrates.

