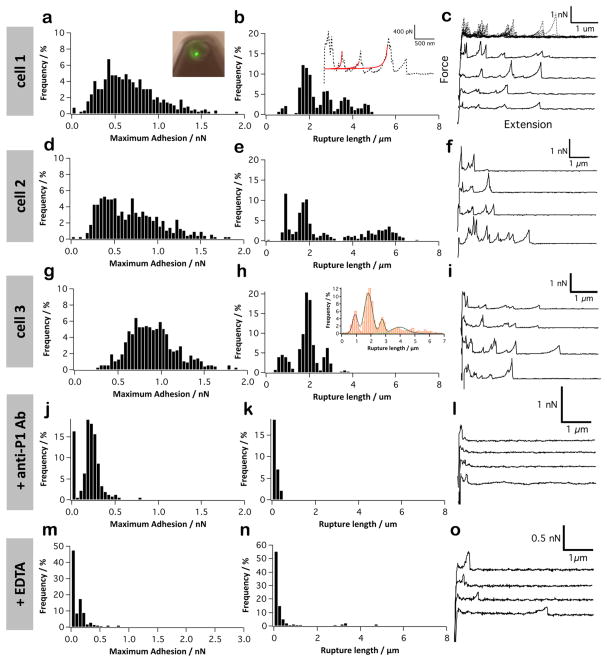
Figure 5.
Single-cell force spectroscopy of the S. mutans-SAG interaction. (a–i) Adhesion force histogram (a, d, and g), rupture length histogram (b, e, and h), and typical force curves (c, f, and i) obtained by recording force curves (n = 300 curves for each condition) in PBS buffer with 1 mM Ca2+ between three different S. mutans bacteria and solid substrates functionalized with SAG. (j–l) Control experiment in which the bacterial cell surface was blocked with a solution of monoclonal antibodies directed against the P1 head. (m–o) Control experiment in which the bacterial cell surface was treated with 10 mM EDTA. The fluorescence image in (a) shows a single living bacterium (in green) immobilized on a colloidal cantilever (see text for details). The inset in (b) shows that most curves with large adhesion force peaks were well-described by the WLC model (red lines). The inset in (h) is the rupture length histogram obtained by merging the data sets of the three cells. A total of 8 different cells from 5 independent cultures were probed.

