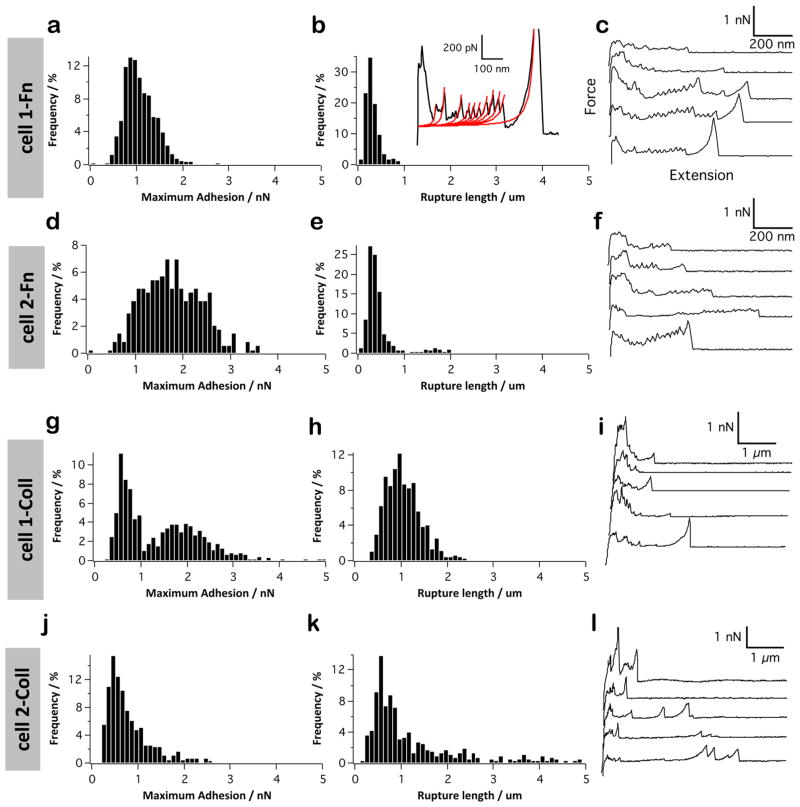
Figure 6.
Interaction forces between S. mutans and fibronectin/collagen. Adhesion force histogram (a, d, g, and j), rupture length histogram (b, e, h, and k), and typical force curves (c, f, i, and l) obtained by recording force curves (n = 300 curves for each condition) in PBS buffer with 1 mM Ca2+ between two different S. mutans bacteria and solid substrates functionalized with either Fn (a–f) or Coll (g–l). The inset in (b) demonstrates that some Fn curves showed sawtooth patterns well-described by the WLC model (red lines).

