Fig 3.

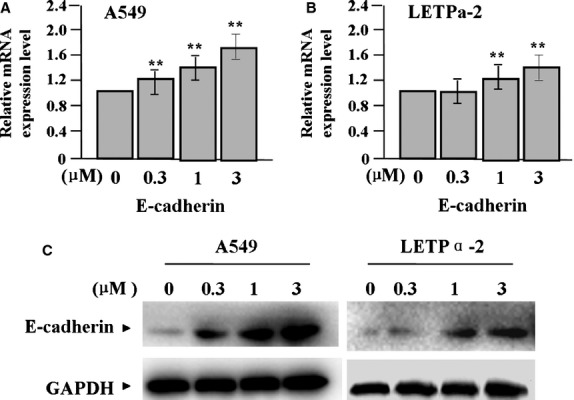
Effect of 17-AAG on the expression of E-cadherin. The expression of E-cadherin mRNA and protein, indicated by real-time PCR (A and B) and Western blot assay (C), was upregulated in 17-AAG treated groups in a dose-dependent manner compared to the untreated group (each **P < 0.01).
