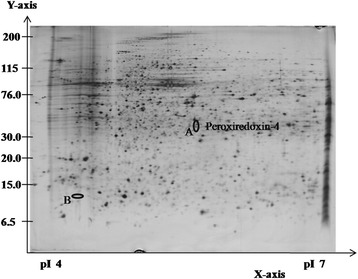
Figure 3.

Representative silver-stained 2DE gel for HepG2 cells with GTT treatment at pH 4–7. The circled and labelled proteins (A and B) are the differentially expressed proteins. Both proteins were exclusively up-regulated during GTT treatment and could not be detected in the protein profile of control HepG2 cells (without GTT treatment).
