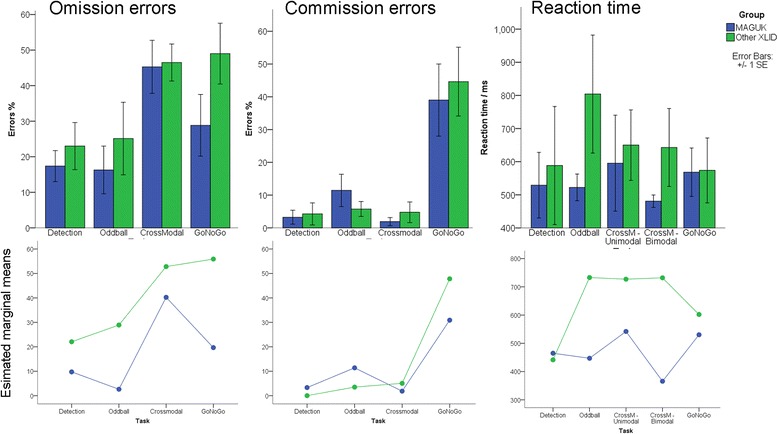
Figure 3.

Attention task performance in MAGUK cases and XLID controls. Analysis of visual attention task parameters for MAGUK (n = 8) and XLID (n = 9) subjects who completed cognitive testing. Bar charts present raw error scores and reaction times (means, standard errors) for each of the four visual attention tasks. Line graphs present age-adjusted and IQ-adjusted marginal means (repeated measures ANOVA). MAGUK, membrane-associated guanylate kinase; XLID, X-linked intellectual disability, SE, standard error.
