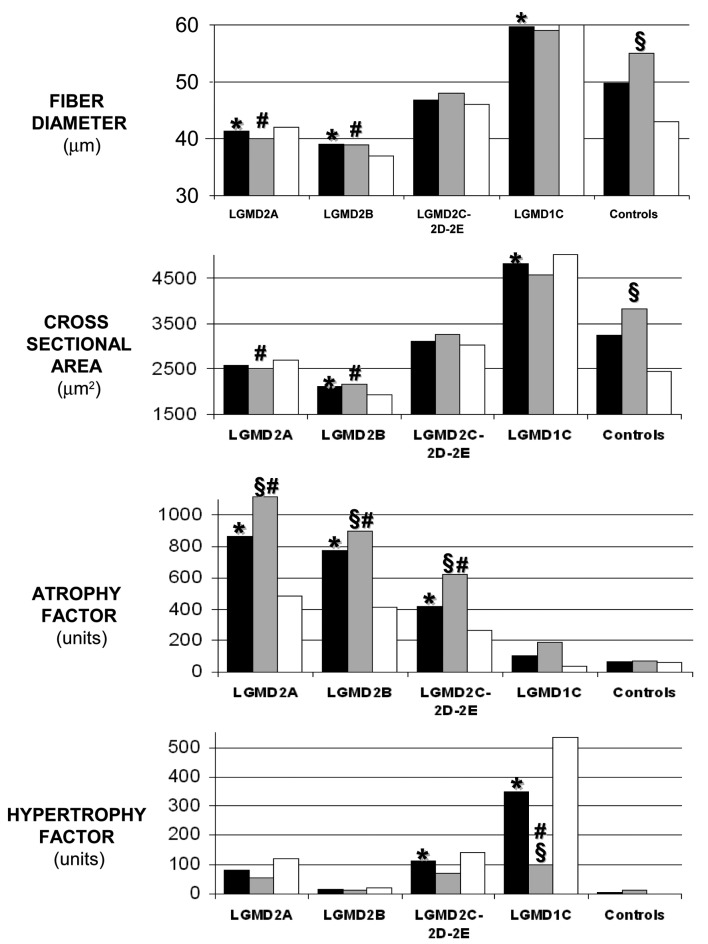
Figure 3.
Histograms showing the comparison between the mean values of fiber diameter, cross sectional area, atrophy factor and hypertrophy factor in the different groups of LGMD patients and in the control group. Black bars = total cases of both genders, gray bars = male patients, white bars = female patients. Significant difference (p < 0.05) is indicated as: * individual disease group versus control group, § males versus females within the same disease group, # one gender of a disease group versus the same gender of the control group.

