
Figure 6.
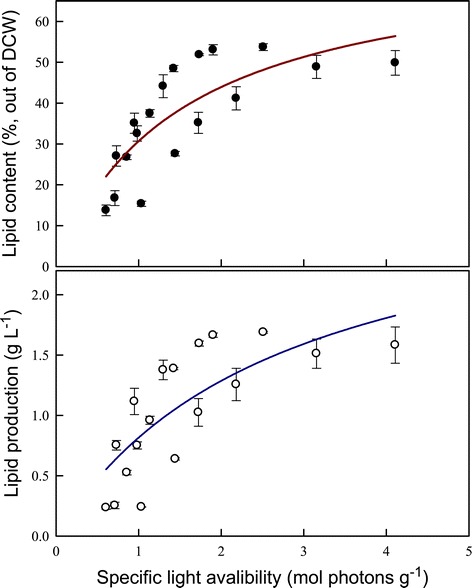
The effect of specific light availability on lipid accumulation over time in Chlamydomonas sp. JSC4. Error bars indicate standard deviation of three replicated experiments (CO2 aeration = 2.0%; CO2 flow rate = 0.1 vvm).
Official websites use .gov
A
.gov website belongs to an official
government organization in the United States.
Secure .gov websites use HTTPS
A lock (
) or https:// means you've safely
connected to the .gov website. Share sensitive
information only on official, secure websites.
The effect of specific light availability on lipid accumulation over time in Chlamydomonas sp. JSC4. Error bars indicate standard deviation of three replicated experiments (CO2 aeration = 2.0%; CO2 flow rate = 0.1 vvm).