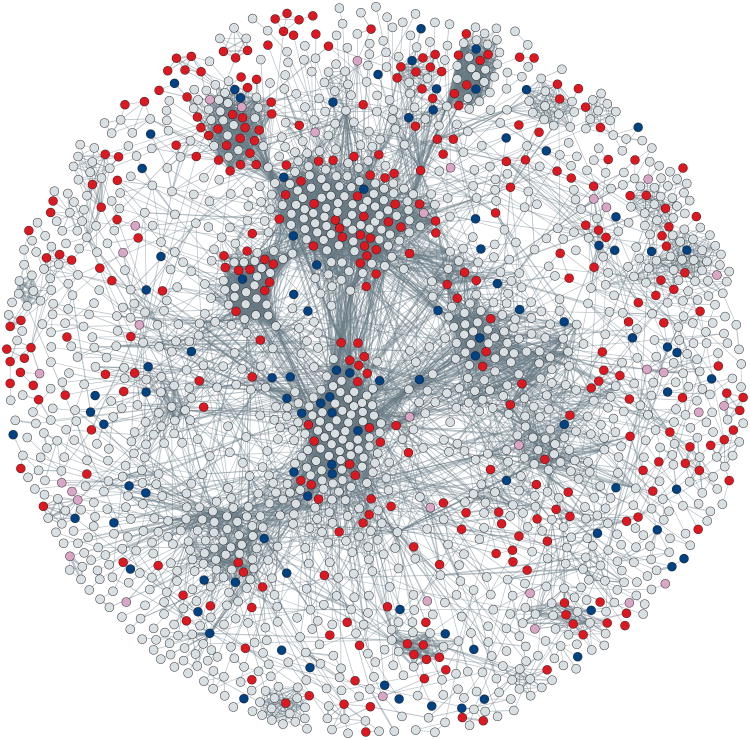
Figure 4. Mapping genetic modifiers on proteome map.
The highly interconnected major component of the Drosophila Protein Interaction Map (DPiM)113, showing Notch signalling modifiers that were identified from Exelixis screens (blue), RNAi screens (red) or both (pink). This overlay of genetic data on a proteomics map helps to combine independent and seemingly disparate data sets into one integrated network while providing potential mechanistic insights into the basic biochemistry of these interactions. Grey lines indicate protein–protein interactions, the thickness being proportional to the interaction score. In many cases, it is clear that several members of a protein complex were identified in independent screens, suggesting that the complex, as a functional unit, is important for Notch signalling. Such integrative analyses provide numerous experimentally testable hypotheses into the links between Notch signalling and these modifiers, as well as their associated functions, as defined in DPiM. Within DPiM, connections between uncharacterized proteins to protein complexes with defined Gene Ontological terms provide a potential function to the uncharacterized proteins. A high-resolution version of this figure is available in Supplementary information S5 (figure).

