
Figure 2.
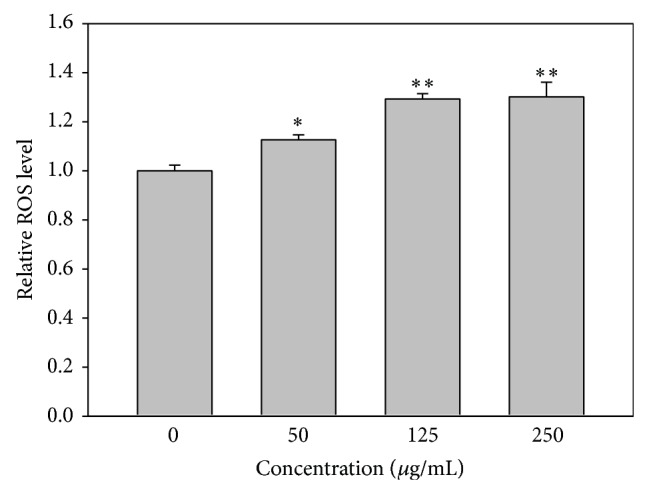
ROS generation of IS-treated HUVECs. Quantification analysis of relative ROS mean intensity of DCFH-DA (% of control). Cells were treated with 0, 50, 125, and 250 μg/mL of IS for 24 h. Data, mean ± SD (n = 3). * P < 0.01; ** P < 0.001 compared to the control.