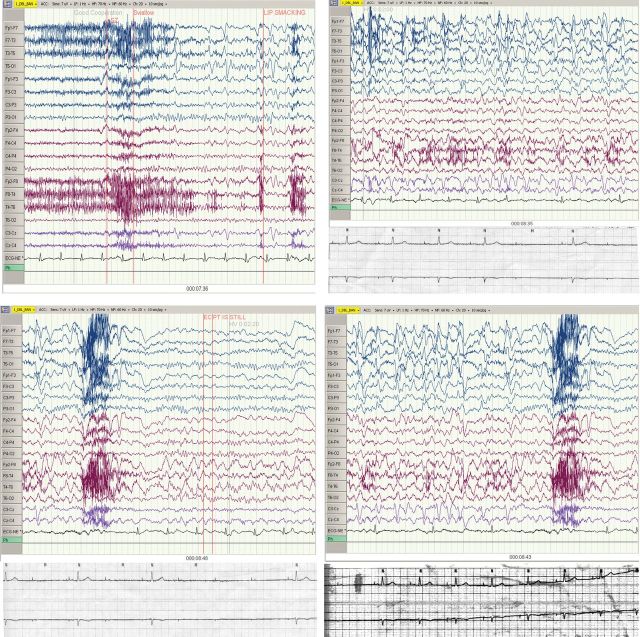
Figure 1:
Top left: Baseline. At 7 min and 36 s into the EEG, there are epileptiform discharges at the end of the strip, and the patient demonstrates lip smacking. There are no changes in the ECG activity at this time, and the patient is in normal sinus rhythm at a rate of 76 beats min−1. Top right: 8 min and 35 s into the EEG. EEG is demonstrating seizure activity. Telemetry strip reveals an atrial paced rhythm at the start, indicating either overdrive suppression of the sinus node or sinus nodal arrest. The atrial paced rhythm with 1:1 AV conduction then changes to an atrial paced rhythm with 2:1 AV block. The bottom panel illustrates this better on a corresponding telemetry strip. Bottom left: 8 min and 43 s into the EEG. 2:1 AV block now progresses to onset of complete heart block. The telemetry strip in the bottom panel illustrates this better, showing changing of 2:1 AV conduction to complete heart block without any escape rhythm for 4 s. Bottom right: 8 min and 48 s into the EEG with cardiac activity returning to normal sinus rhythm. The bottom panel shows the final section of telemetry showing complete heart block reverting back to an atrial paced rhythm with 1:1 AV conduction.

