
Fig. 10.
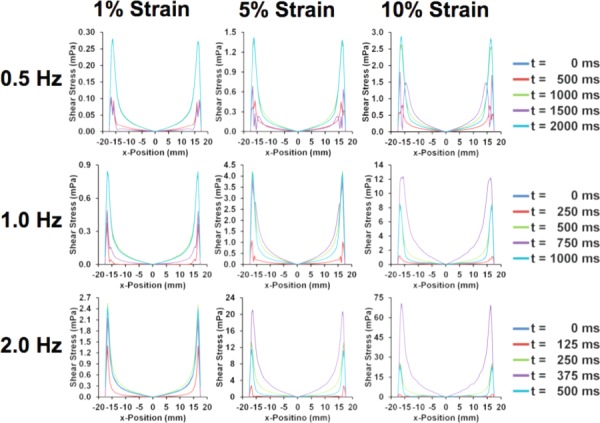
Circumferential average shear stress during last cycle of the simulation. The zero point indicates the center of the well with an average taken circumferentially at each radius. All frequencies (0.5, 1, and 2 Hz) and maximal strain (1%, 5%, and 10%) are shown.