
Fig. 4.
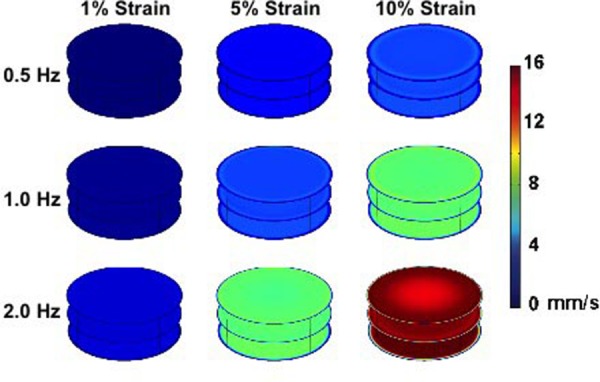
Maximal magnitude of velocity within the system for each of the frequencies tested (0.5, 1, and 2 Hz) as the membrane displaces. The plotted time was chosen as the time when there was the maximum velocity in the horizontal slices from all time points examined in the last cycle of loading. Plotted times are from the last cycle of loading for 0.5 Hz (time = 14.5 s), 1 Hz (time = 14.25 s), and 2 Hz (time = 14.625 s). Horizontal cut planes through the well with the bottom, middle, and top of the well are shown. Maximum strains of 1%, 5%, and 10% were investigated at each frequency. The bottom plane shows the velocity of the displacing surface, and the top plane shows the velocity at the top of the well. Higher velocity is observed toward the middle of the well. To aid visualization, the displacement of the membrane is not shown in the simulation.