
Fig. 6.
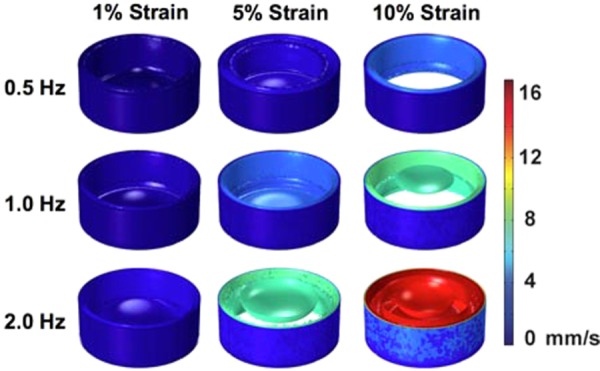
Velocity isosurfaces for the time with maximal velocity for each frequency of loading (0.5, 1, and 2 Hz) as the membrane displaces. Maximum strains of 1%, 5%, and 10% were investigated at each frequency. The plotted time was chosen as the time when there was the maximum velocity in the well from all time points examined in the last cycle of loading. Plotted times are from the last cycle of loading for 0.5 Hz (time = 14.5 s), 1 Hz (time = 14.25 s), and 2 Hz (time = 14.625 s). Each isosurface color shows a surface with a constant velocity within the well in millimeter per second. Higher velocity is observed toward the middle of the well.