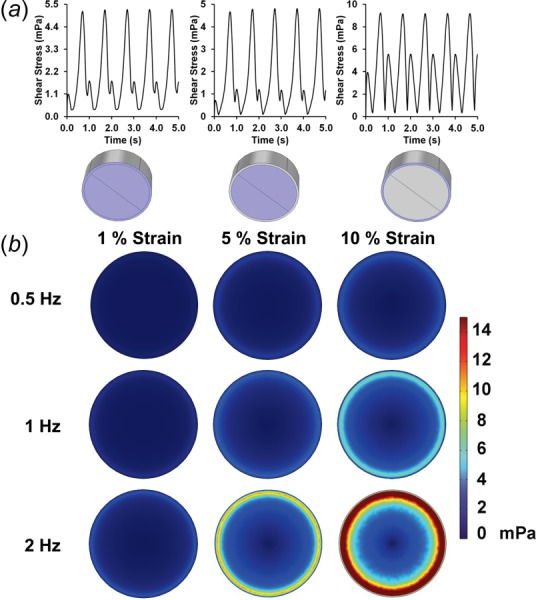
Fig. 7.

(a) Average shear stress over the first cycles of loading for the total, central, and outer regions of the bottom surface of the well. Conditions shown are for 10% maximal strain and 1 Hz frequency of loading. (b) Average shear stress on the bottom of the plate over the last cycle of the simulation.
