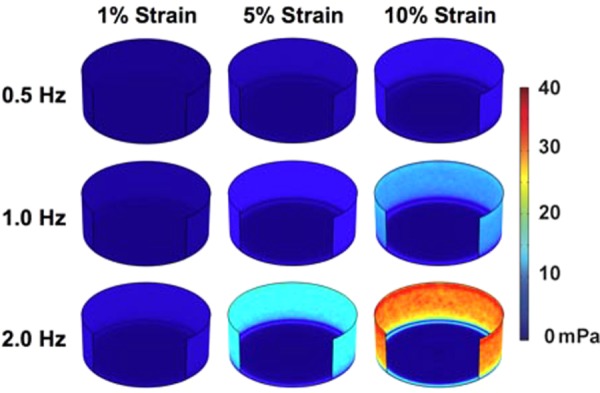
Fig. 8.

Maximal shear stress on the surfaces of the well during the loading cycle. Within each frequency group, the time point chosen is held constant and is set for the time of maximal shear stress. Maximum strains of 1%, 5%, and 10% were investigated per frequency. The plotted time was chosen as the time when there was the maximum shear stress on the well surfaces from all time points examined in the last cycle of loading. Plotted times are from the last cycle of loading for 0.5 Hz (time = 14.5 s), 1 Hz (time = 14.25 s), and 2 Hz (time = 14.625 s). Higher shear stress is observed toward the wall. The quarter front wall has been removed to aid visualization.
