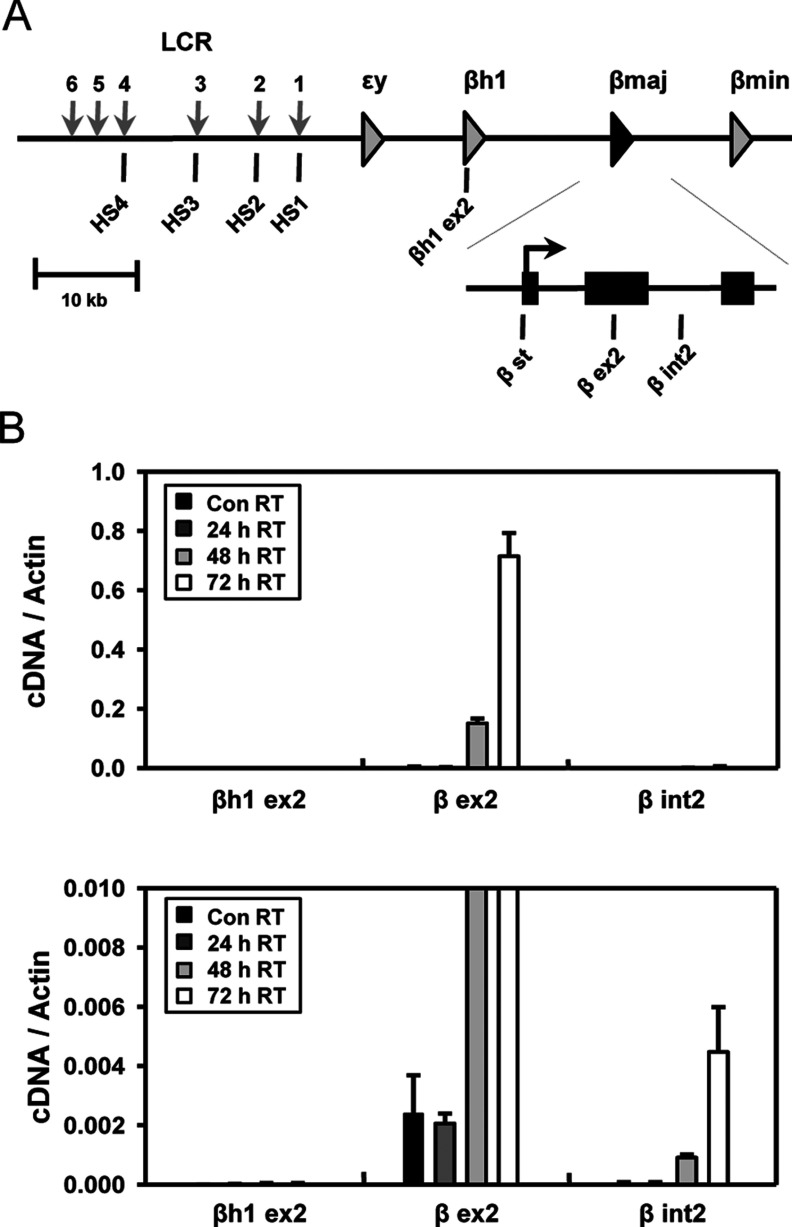
Figure 1. Transcript levels of the β-major-globin gene in HMBA-treated MEL cells.
(A) The mouse β-globin locus is presented. Vertical grey arrows indicate DNase I HSs in the LCR. The exons of the β-major-globin genes are represented by black squares in the extended diagram. Vertical bars named below the diagram denote the locations of TaqMan amplicons used in RT-PCR. (B) cDNA was prepared from RNA isolated from MEL cells at uninduced state (Con) and induced states for 24, 48 and 72 h with HMBA. Transcript levels of the βh1 and β-major-globin gene were measured at the four stages by comparing with transcript levels of the actin control gene. Same data were represented with different y-scale in a bottom graph. The results are averages of 3–4 independent experiments ± S.E.M.

