
Figure 2. Relative proximity between the LCR HSs and β-major-globin gene in HMBA-treated MEL cells.
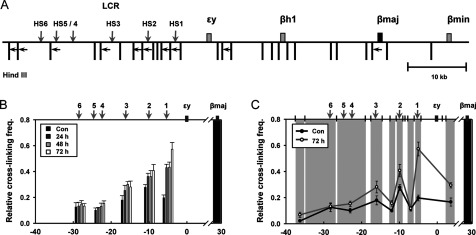
(A) 3C assay was performed with HindIII restriction enzyme. HindIII sites and PCR primers in the mouse β-globin locus were represented by vertical bars and horizontal arrows respectively. (B) The black shading represents the anchor fragment for β-major-globin gene in PCR. Relative cross-linking frequency with fragments for the LCR HSs was presented at unindicted stage and three stages after transcriptional induction. (C) The black shading represents the anchor fragment and the grey shadings are fragments generated by HindIII digestion. Relative cross-linking frequency with fragments between the LCR HSs was additionally presented at uninduced and 72 h induced stages. Relative cross-linking frequency was determined by quantitatively comparing ligated DNA in cross-linked chromatin with control DNA and then by normalizing to the cross-linking frequency in the Ercc3 gene. The results are averages of 5–6 independent experiments ± S.E.M.