
Figure 3. Transcription on the mouse β-globin LCR HSs in HMBA-treated MEL cells.
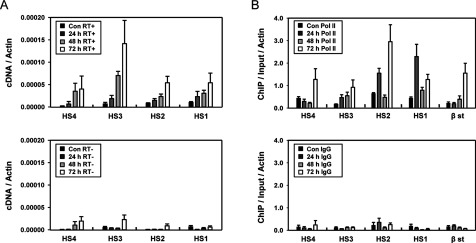
(A) RT-PCR was performed in MEL cells at the four stages before and after transcriptional induction with or without reverse transcriptase (RT+ or RT−) and analysed as described in Figure 1(B). (B) ChIP was performed with antibodies specific to RNA polymerase II over a time course. Relative intensity was determined by quantitatively comparing immunoprecipitated DNA with input for the indicated amplicons and normalizing to the intensity at the actin gene. Normal rabbit IgG (IgG) served as experimental control. The results are average of 3–4 independent experiments ± S.E.M.