
Figure 1.
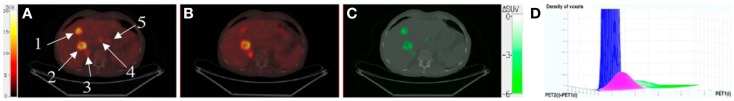
(A) PET1 showing five tumors, superimposed with CT1. (B) PET2 superimposed with CT2. (C) Parametric image (superimposed with CT1) showing only voxels with significant tumor changes between PET1 and PET2. These voxels are shown in green, meaning that SUV decreased between the two scans. For the two biggest tumors, the EORTC-based approach found a responding lesion (SUV decrease of 27% for tumor 1) and a stable lesion (SUV decrease of 10% for tumor 2). Parametric imaging found two responding lesions (ΔSUV = −5.9 and −2.6 for tumors 1 and 2, respectively), which were consistent with RECIST classification derived from late CT. (D) Biparametric graph fitted by the gaussian mixture model, for which three clusters can be distinguished: noise (blue), physiologic changes (pink), and tumor changes (green). This research was originally published in Journal of Nuclear Medicine. Necib et al. (83). ©by the Society of Nuclear Medicine and Molecular Imaging, Inc.