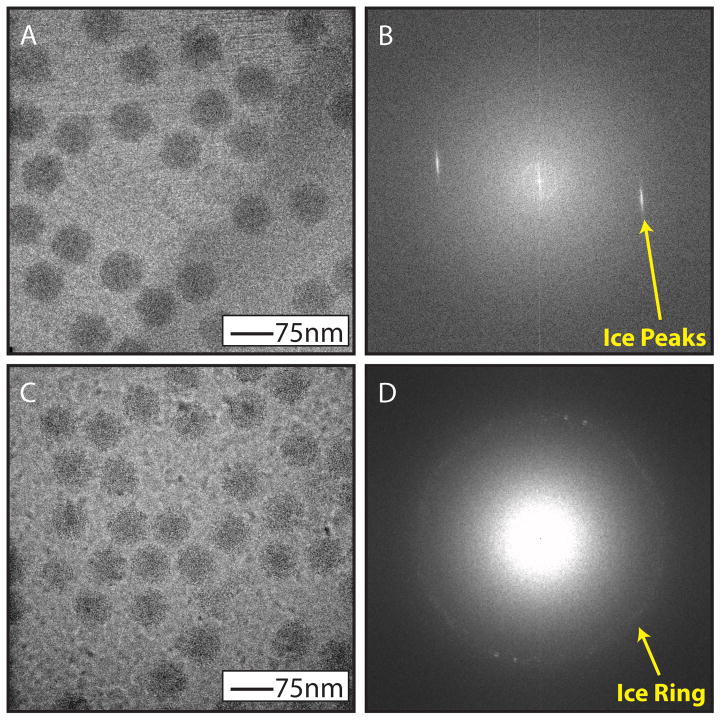
Figure 3.
Ice contamination. When the sample in suspension on a grid is not fully vitrified during freezing it is possible to see other forms of ice. Hexagonal ice formation will look like striations in the image (A) and a Fourier transform of the image will contain discrete ice peaks (B). Cubic ice formation will look like nodules in the image (C) and a Fourier transform of the image will contain an “ice ring” in the Fourier transform at a specific spatial frequency (D). N.B. The virus sample shown in panels A and C are of bacteriophage epsilon15 not HSV-1.

