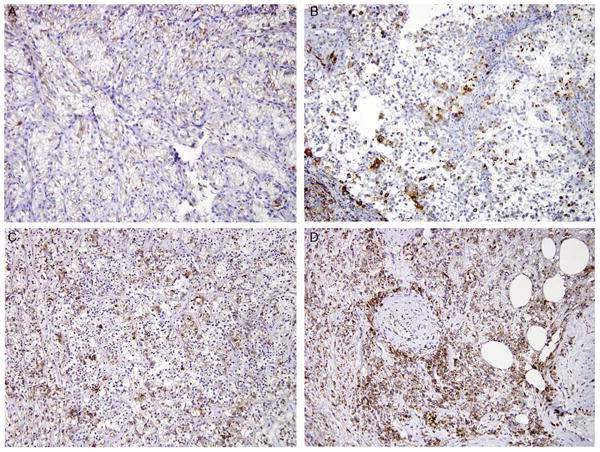
Figure 4.

IHC labeling for pS6 in renal neoplasms. All these images are taken at ×20 magnification. Progressively increased labeling is seen in clear cell RCC (A), Xp11 translocation RCC (B), and t(6;11) RCC (C). The most diffuse and intense labeling is seen in epithelioid angiomyolipoma (D).
