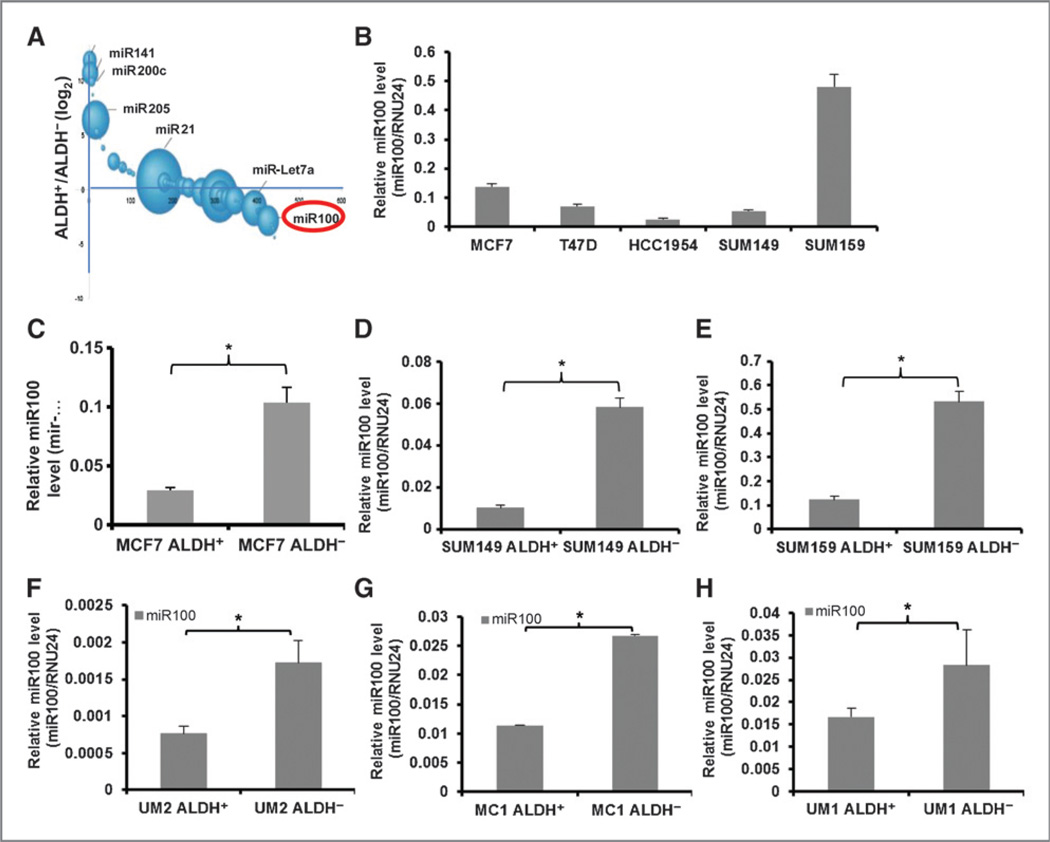
Figure 1.
Comparison of miR100 expression in different cell populations. A, a bubble plot depicting the relative abundance and log2 ratio of miRNAs in SUM159 cells. B, miR100 expression level was measured indifferent cell lines by qRT-PCR. ALDH+ cells from MCF7 cells (C), SUM149 cells (D), SUM159 cells (E), or primary breast tumor xenografts UM2 (F), MC1 (G), and UM1 (H) show lower miR100 expression level in comparison with ALDH− cells from the same cell lines as accessed by qRT-PCR. * P < 0.05. Error bars, mean ± SD.

