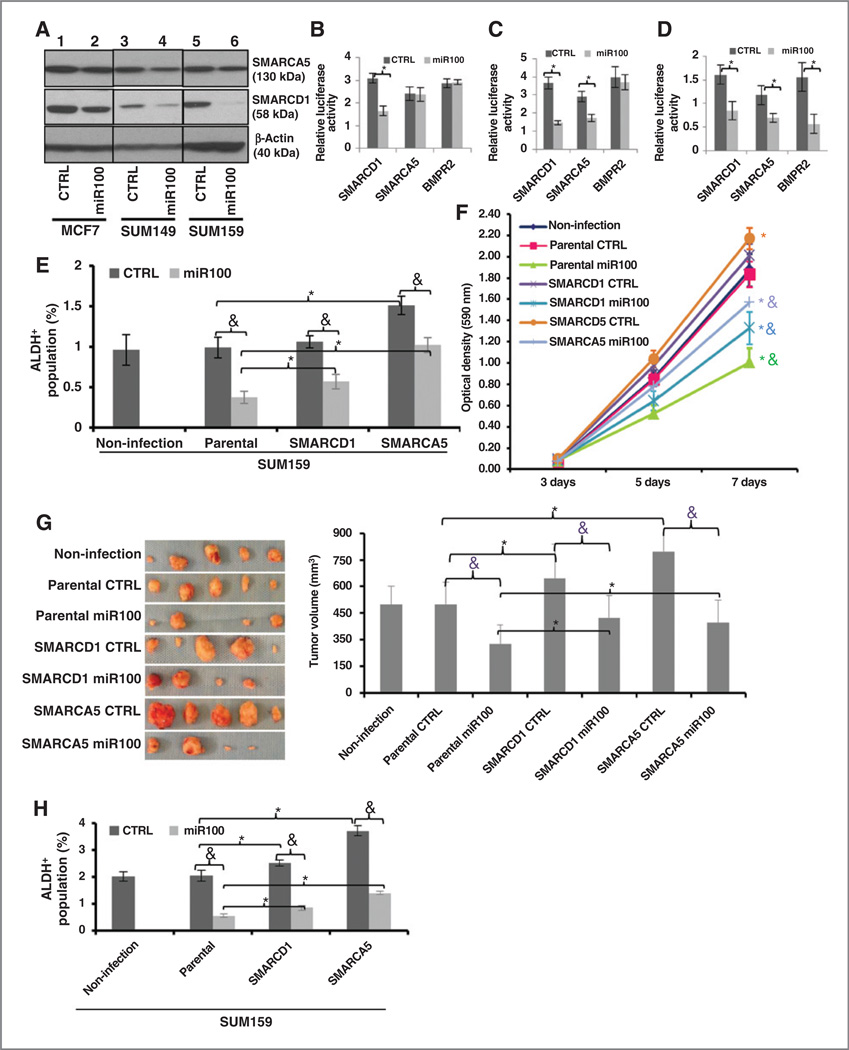
Figure 5.
SMARCA5 and SMARCD1 are direct and functional targets of miR100. A, targets (SMARCA5 and SMARCD1) are verified by Western blot analysis in all three cell lines. B–D, activity of the luciferase gene linked to the 3′ UTR of SMARCD1, SMARCA5, or BMPR2. The pMIR-REPORT or LightSwitch 3′ UTR luciferase reporter plasmids were transiently transfected into pTRIPZ-miR100 cell lines [MCF7 (B); SUM149 (C); SUM159 (D)]and an internal control ACTB luciferase reporter was cotransfected for normalization. The relative luciferase activity was calculated as the ratio of the results from the cells transfected by individual reporter/the results from the cells transfected by the internal control in the same cell group. The data are mean and SD of separate transfections (n = 4). E and F, overexpression of human SMARCA5 and SMARCD1 lacking 3′ UTR partially overcome the decrease of ALDH+ cells and the inhibition of cell proliferation by miR100 induction in SUM159 cells. G, overexpression of human SMARCA5 and SMARCD1 lacking 3′ UTR partially overcome the inhibition of tumor growth by miR100 induction in SUM159 cells. Fifty thousand cells from different groups were injected into the fourth fat pads of NOD/SCID mice. The treatment was started when the tumors reached to the average size of 10 mm3 in the control group and the treatment lasted for 8 weeks. miR100 was induced by adding doxycycline (DOX, 1 mg/mL) in drinking water. At the end of the treatment, the tumors were taken out and the tumor images (left) and tumor size (right) are shown. H, overexpression of human SMARCA5 and SMARCD1 lacking 3′ UTR partially overcome the decrease of ALDH+ cells by miR100 induction in SUM159 tumors. Cells were isolated from each tumor collected in G and ALDH was accessed by the Aldefluor assay on viable dissociated cells. * P < 0.05 (compared with the corresponding parental group); &, P < 0.05 (compared with the corresponding CTRL group). Error bars, mean ± SD.

