. 2015 Mar 24;4:e05098. doi: 10.7554/eLife.05098

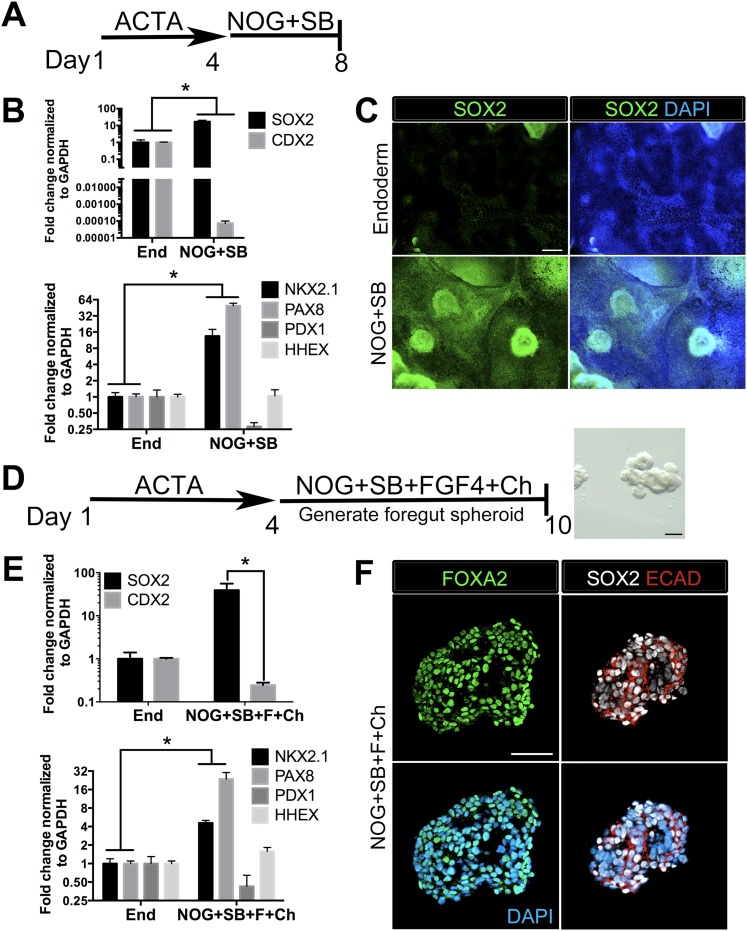
Figure 1. Generation of three-dimensional ventral anterior foregut spheroids from endoderm monolayers.

(A) hESCs were differentiated into foregut endoderm by treating cells with 4 days of Activin A (ACTA) followed by 4 days of NOG+SB. (B) Foregut endoderm (NOG+SB) had high expression of the foregut marker SOX2 while the hindgut marker CDX2 was significantly reduced compared to untreated endoderm controls (End). NOG+SB monolayers had high expression of ventral anterior foregut genes NKX2.1 and PAX8 while the posterior foregut marker PDX1 was reduced. The foregut marker HHEX is expressed in the developing liver, biliary system, and thyroid and remained unchanged. (C) The majority of cells in NOG+SB treated cultures were SOX2 positive (green) compared to the control, in which only scattered clusters of cells were SOX2 positive. The scale bar represents 200 µm. (D) hESCs were differentiated into foregut spheroids by treating cells with 4 days of ACTA and then additional 4–6 days of NOG+SB+FGF4+Ch. Representative images of a spheroid in a matrigel droplet are shown as a whole mount image. Scale bar represents 100 µm. (E) Foregut spheroids (NOG+SB+FGF4+Ch) had high expression of the foregut marker SOX2 while the hindgut marker CDX2 was significantly reduced compared to untreated endoderm control (End) (top panel). Spheroids had high expression of anterior foregut genes NKX2.1 and PAX8 while the posterior foregut marker PDX1 was reduced and HHEX was unchanged (bottom panel). *p < 0.05, error bars represent SEM. (F) The majority of cells in foregut spheroids are FOXA2+ (green, left panel) and SOX2+ (white, right panel) and ECAD+ (red, right panel). Scale bar represent 50 µm.

DOI: http://dx.doi.org/10.7554/eLife.05098.003

Figure 1.

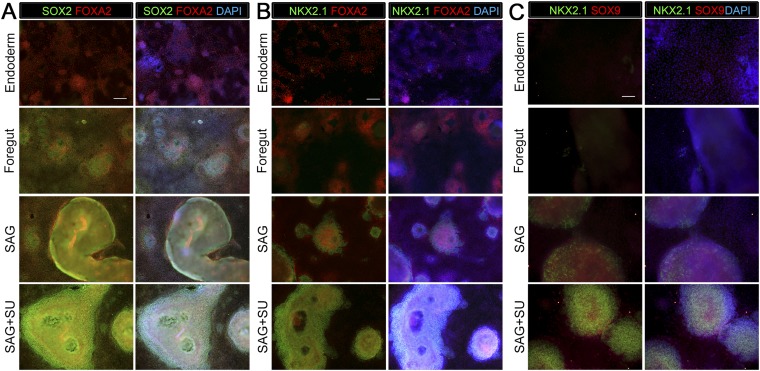
Figure 1—figure supplement 1. Monolayer cultures express lung specific markers.

Figure 1—figure supplement 1.

Immunohistochemistry for markers expressed in endoderm, ventral foregut or lung epithelium were assessed (SOX2, FOXA2, NKX2.1, SOX9) in endoderm controls, foregut controls or foregut cultures treated with SAG or SAG+SU. (A) All conditions express endoderm marker FOXA2 (red), but the foregut (NOG+SB) control, SAG and SAG+SU treated cultures have co-expression of FOXA2 (red) and SOX2 (green) in the majority of cells. (B) All conditions expressed endoderm marker FOXA2 (red), but only foregut endoderm treated with SAG and SAG+SU have robust NKX2.1+ cells (green) that also express FOXA2 (red). (AB) Scale bars represent 200 µm and apply to all images. (C) Only foregut endoderm treated with SAG and SAG+SU have robust NKX2.1+ cells (green) with the majority of cell co-expressing with lung epithelial marker SOX9 (red). Scale bar represents 100 µm.
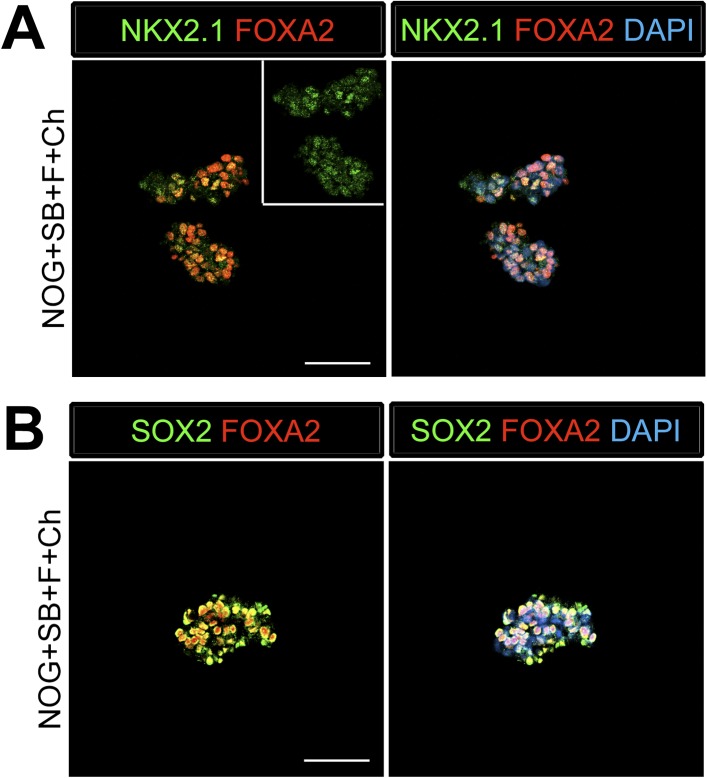
Figure 1—figure supplement 2. Foregut spheroids co-express endoderm and lung specific markers.

Figure 1—figure supplement 2.

(A) NOG/SB/FGF4/Ch spheroids have weak NKX2.1 (green) expression which co-expresses with endoderm marker FOXA2 (red). (B) The majority of cells in the spheroid express SOX2 (green) and co-stain with FOXA2 (red). Scale bars represent 50 µM.
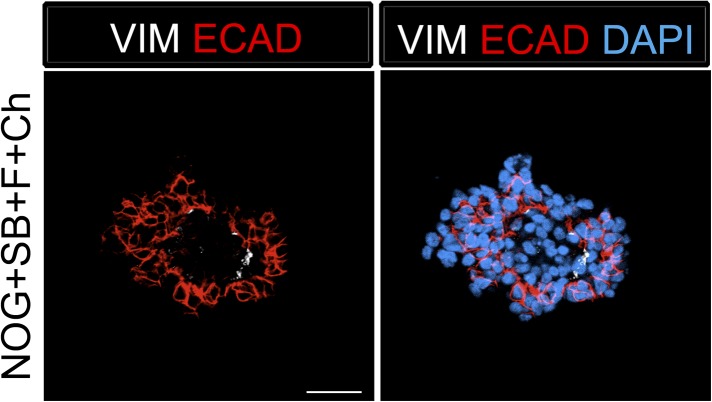
Figure 1—figure supplement 3. Foregut spheroids consist of both epithelial and mesenchymal cells.

Figure 1—figure supplement 3.

NOG/SB/FGF4/Ch spheroids have a minor population of Vimentin (VIM, white) positive mesenchymal cells, while the majority of cells are epithelial and express ECAD (red). Scale bar represents 50 µM.
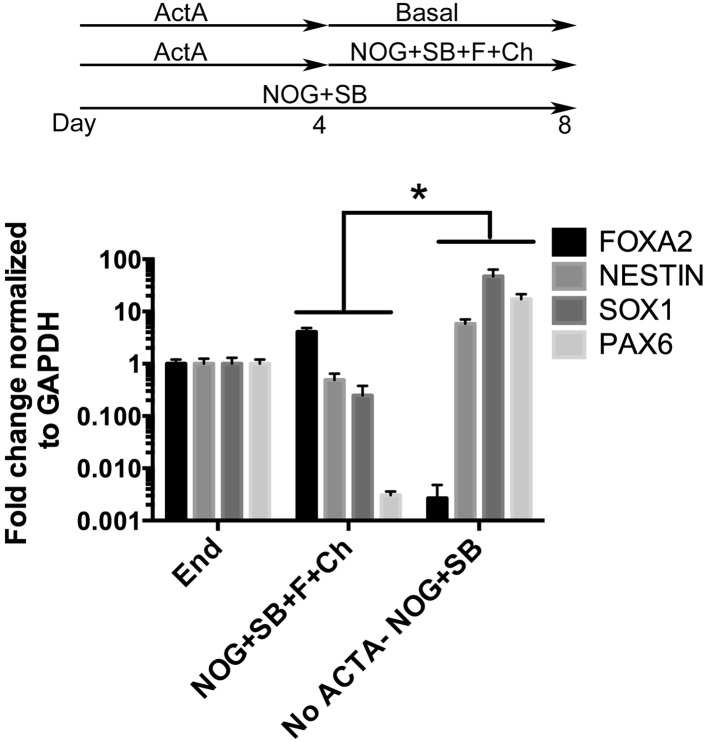
Figure 1—figure supplement 4. NOG+SB+FGF4+Ch spheroids do not express neural markers.

Figure 1—figure supplement 4.

hESCs were differentiated into endoderm by treating with 4 days of ActivinA (ACTA) and spheroids were generated with an additional 4 days of NOG+SB+FGF4+Ch. Neural cultures were not treated with ACTA, but were treated with NOG+SB for 8 days. Compared to foregut spheroids (NOG+SB+FGF4+Ch), NOG+SB neural cultures had a significant increase in neural markers NESTIN, SOX1, and PAX6 and significant decrease in FOXA2, which is highly expressed in endoderm. *p < 0.05, error bars represent SEM.