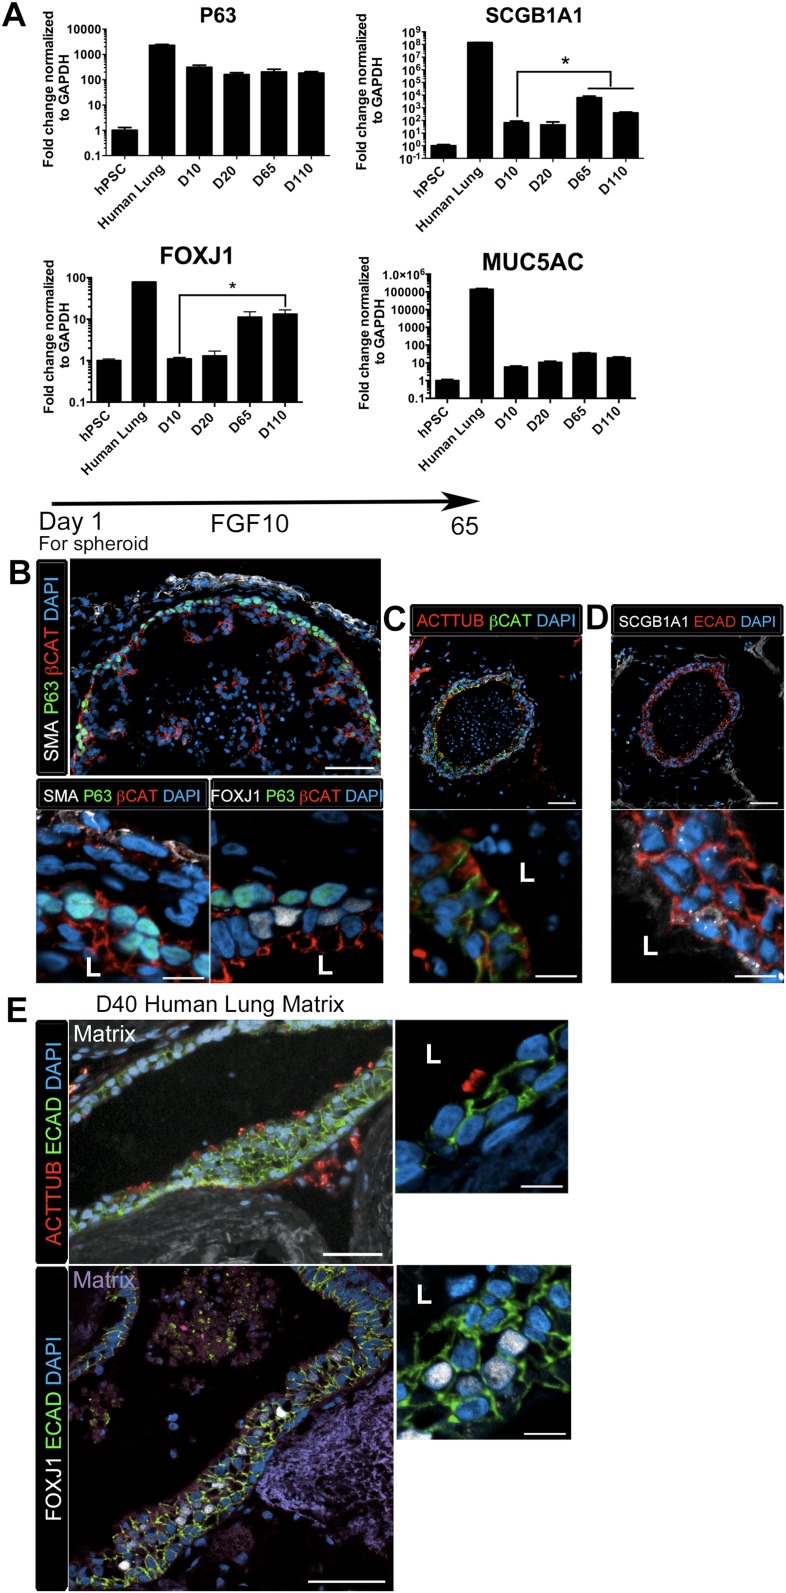
Figure 4. Lung organoids form proximal airway-like structures.
(A) Genes expressed in the proximal airway were examined in organoids across time. The proximal airway cell marker SOX2 decreased over time in HLOs cultures compared to D10 HLOs. Compared to undifferentiated hPSCs, organoids expressed high levels of the basal cell marker P63 at all time points, while expression of the club cell marker SCGB1A1 and ciliated cell marker FOXJ1 increased significantly in prolonged cultures (compared to D10 HLOs). There was an increasing but non-significant trend in goblet cell MUC5AC expression over time in culture. (B) D65 HLOs had structures resembling the proximal airway, in which the epithelium (β-catenin, red) possesses P63+ basal cells (green), and is surrounded by SMA+ (white, upper and lower left panel) mesenchymal tissue. Adjacent to the P63 positive basal cell layer (green, lower, right panel) were FOXJ1 positive cells (white). Scale bars represent 50 µM (top) and 10 µM (bottom). (C) Proximal airway-like epithelium (β-catenin, green) co-stained for ACTTUB on the apical side of the cell (red). Scale bars represent 50 µM (top) and 10 µM (bottom). (D). Proximal airway-like epithelium (E-cadherin, red) also co-stained with Club cell marker CC10 (white, right panel). Scale bars represent 50 µM (top) and 10 µM (bottom). (E) Acellular human lung matrix was seeded with spheroids and cultured for 40 days (D40). Matrices had abundant proximal airway-like structures that had multi-ciliated cells on the apical surfaced labeled by ACTTUB (red, top panel) in low (scale bar 50 µM) and high magnification (scale bar 10 µM). Serial sections showed that cells were also FOXJ1 positive (white, lower panel) with the epithelium outlined in ECAD (green) in low (scale bar 50 µM) and high magnification (scale bar 10 µM). (B–D) ‘L’ in high magnification images indicates the lumen. *p < 0.05. All error bars represent SEM.


