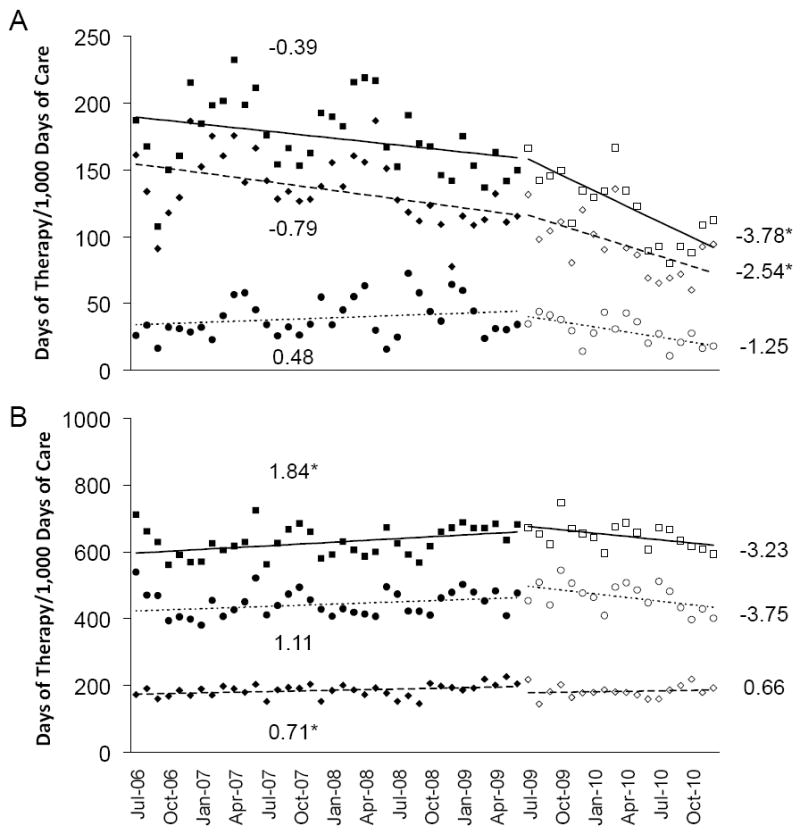
Figure 1.

Observed rates of antibiotic use before and after initiation of the LID Consult Service, shown as black and white symbols, respectively, in the (A) LTCF and the (B) hospital. The corresponding lines and their slopes (indicated on the graph) represent the estimated rates of change in antimicrobial use for total antimicrobials (squares), oral agents (diamonds) and intravenous agents (circles), determined using segmented regression analysis of an interrupted time series. * P ≤ .05.
