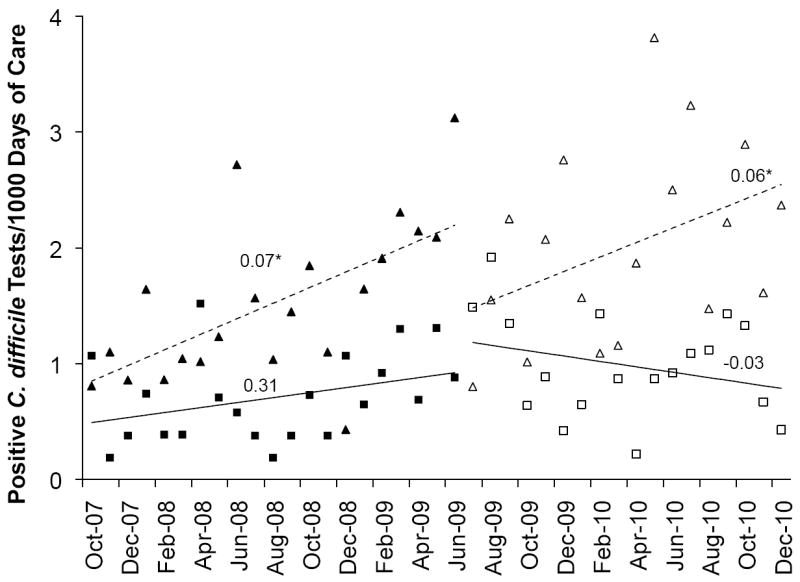
Figure 3.

Observed rates of change in positive C. difficile tests at the LTCF (squares) and hospital (triangles) before (black symbols) and after (white symbols) initiation of the LID Consult Service. The corresponding lines and their slopes (noted on graph) represent the estimated rates of change for positive C. difficile tests at the LTCF (solid lines) and the hospital (dashed lines), determined using segmented regression analysis of an interrupted time series. * P ≤ .05.
