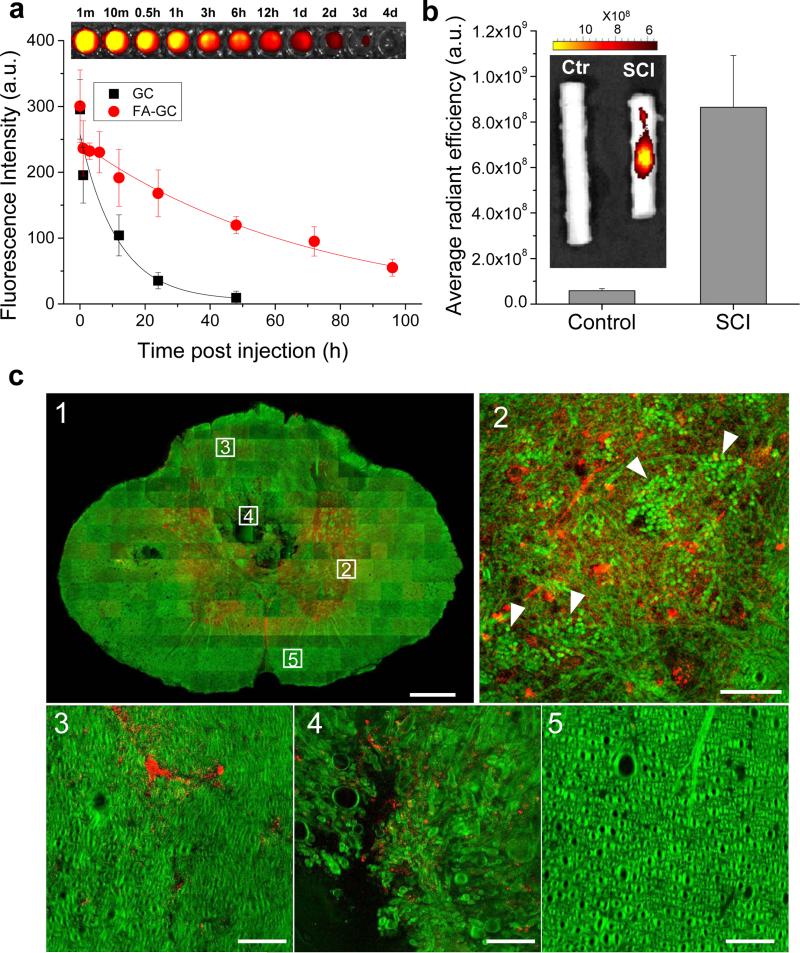
Figure 3. FA-GC nanoparticles exhibited long blood retention time and targeted delivery to injured spinal cord.
(a) Blood retention kinetics of FA-GC(−Cy5.5) and GC(−Cy5.5) in SCI rats. FA-GC(−Cy5.5) and GC(−Cy5.5) (both at 16 mg/kg, 1 ml in saline) were intravenously injected at 2 h post SCI. The data were fitted with a one-compartment model (y = Ae(−x/t) + y0). The Fluorescence of FA-GC(−Cy5.5) in blood samples, drawn at different time points, were visualized (top). (b) Fluorescence imaging and quantification of FA-GC(−Cy5.5) in normal and injured spinal cords. (c) Distribution of FA-GC(−Cy5.5) in injured spinal cord. FA-GC and cord were visualized using two-photon fluorescence for Cy5.5 (red) and stimulated Raman loss signal from C-H vibration (green), respectively. A cross section through the injury epicenter shows the distribution of FA-GC (c1). Dotted squares represent high magnified images of the distribution of FA-GC (red) in the gray matter (c2), the dorsal funicular white matter (c3), the ventral portion of the dorsal funiculus (c4), and the ventral funiculus (c5). White arrows in c2 indicate packed red blood cells (Scale bar: 100 μm for C1 and 5 μm for c2-5).

