Figure 2.
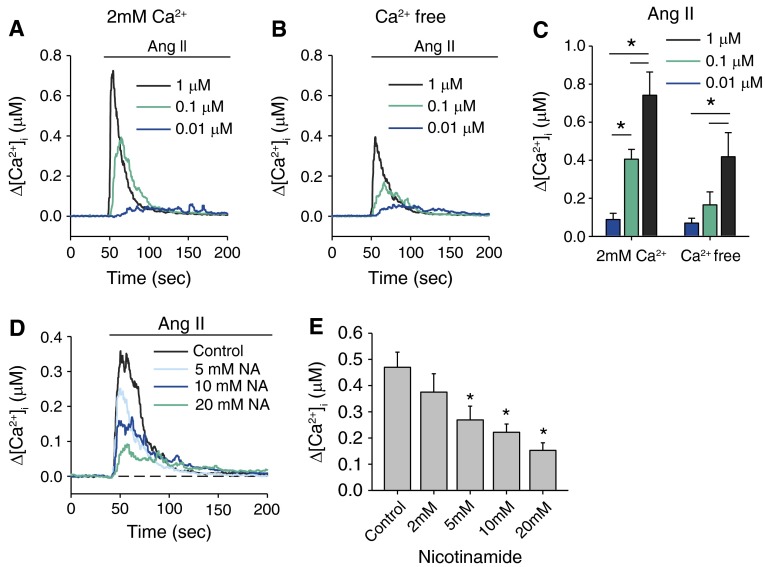
Nicotinamide (NA) inhibited angiotension II (Ang II)–induced Ca2+ release in rat PASMCs. (A and B) Average Ca2+ transient (Δ[Ca2+]i) activated by different concentrations of Ang II (10 nM, 100 nM, and 1 μM) in the presence (2 mM Ca2+) or absence (containing 1 mM EGTA) of extracellular Ca2+. (C) The average increase (Δ peak, right panel) in [Ca2+]i induced by different concentrations of Ang II (n = 6–7 experiments in each group; P < 0.05). *Significant difference between the groups. (D) Averaged traces of Ang II–induced Ca2+ transients elicited 100 seconds after removal of Ca2+ in the absence or presence of different concentrations (2, 5, 10, and 20 mM) of the CD38 inhibitor NA. (E) Averaged peak change in [Ca2+]i in the various groups (n = 8–10 experiments in each group). *Significant differences when compared with control (5 mM, P = 0.007; 10 mM, P < 0.001; and 20 mM, P < 0.001).

