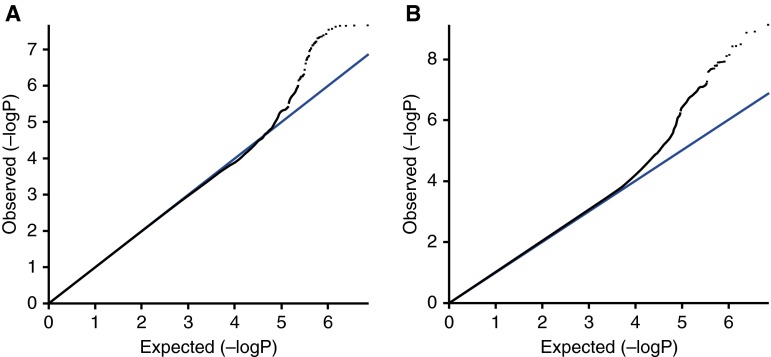
Figure 2.
The quantile–quantile plots (black) for the meta-analysis including 1,000 Genomes project imputed data of (A) subjects with COPD with PAE (PA/A > 1) versus those without PAE (PA/A ≤ 1), and (B) subjects with COPD with PAE versus smokers with normal spirometry, after adjustment for age, sex, pack-years of cigarette smoking, and genetic ancestry using principal components. The reference lines (blue) show the values where the observed (−logP) is equal to the expected (−logP).

